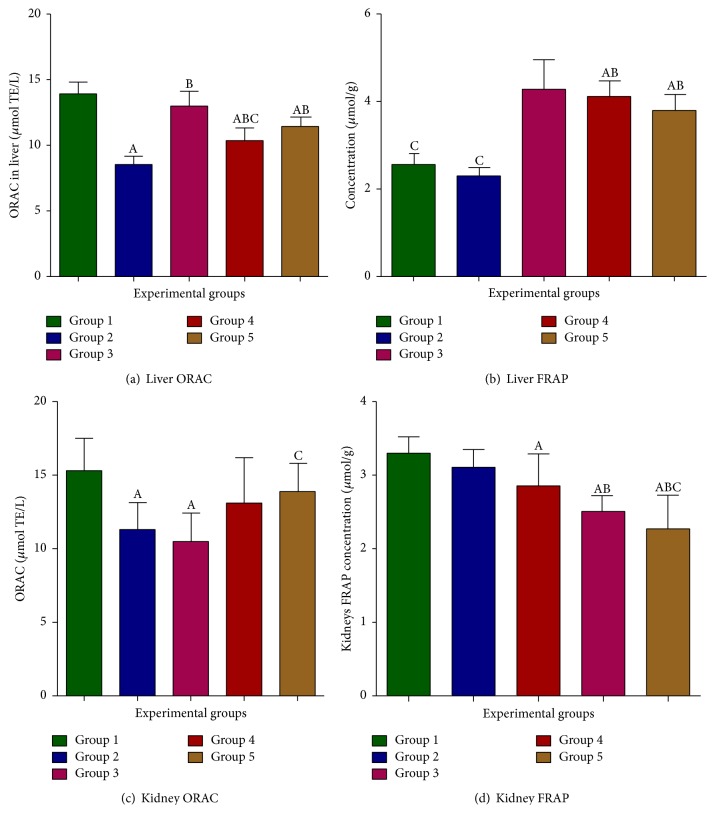
Figure 2.
Effects of H. hemerocallidea on tissue antioxidant status. Group 1: normal control; group 2: diabetic control; group 3: diabetic group fed with 800 mg/kg of H. hemerocallidea; group 4: diabetic group fed with 200 mg/kg of H. hemerocallidea; group 5: normal controls (nondiabetic) fed with 800 mg/kg of H. hemerocallidea; A represents a significant difference when compared to group 1 control at P < 0.05; B indicates significant difference of groups when compared to group 2 at P < 0.05; and C represents significant differences of values in groups when compared to group 3; value in columns indicates means and ± standard error means (SEM).

