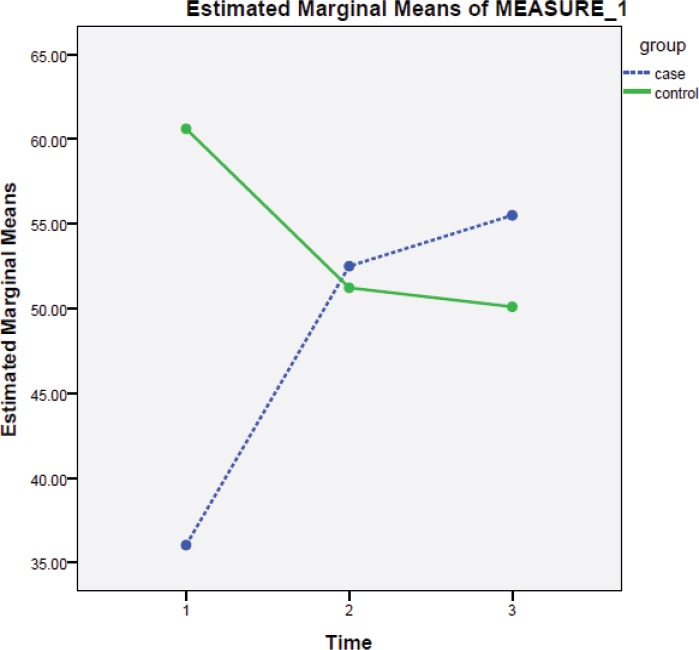
Figure 2.

The mean changes of QOL increased in the intervention group and decreased in the control groups over the time (Time 1: Before intervention, Time 2: Immediately after intervention, Time 3: One month after intervention)

The mean changes of QOL increased in the intervention group and decreased in the control groups over the time (Time 1: Before intervention, Time 2: Immediately after intervention, Time 3: One month after intervention)