
Figure 2.
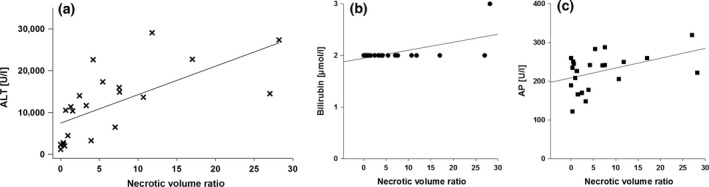
XY plots of surrogate markers of liver cell damage, ALT, AP and bilirubin, and histological findings of liver cell necrosis after 4 h of reperfusion. (a) Pearson's correlation coefficient is r 2 = 0.44 (P = 0.00); (b) the coefficient is r 2 = 0.35; and (c) the coefficient is r2 = 0.19.