
Figure 4.
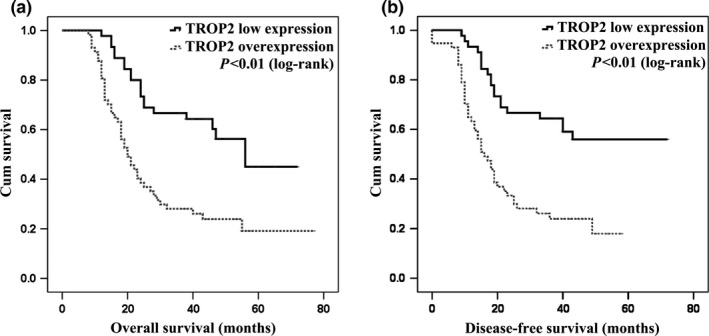
Prognostic significance of TROP2 in patients with EOC as determined using Kaplan–Meier analysis. Patients with TROP2 overexpression (grey‐dash line) had poorer OS and DFS than patients with TROP2 low expression (black line), as measured using the log–rank test (P < 0.01).