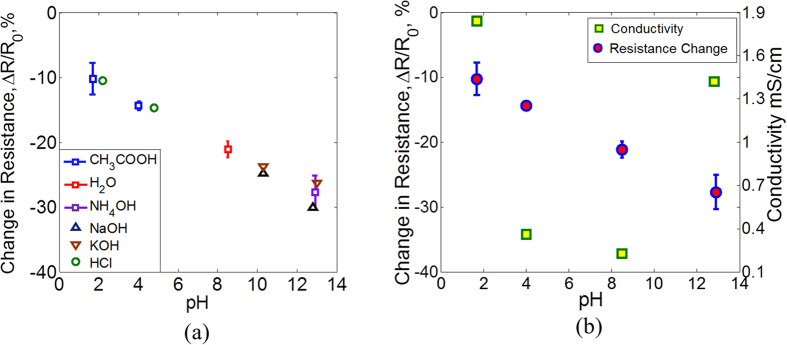
Figure 6. Resistive sensor characterization.
(a) The resistance value decreases for increasing levels of pH. The maximum variation in the resistance change is around ±2.6% as shown by the error bars for CH3COOH, H2O and NH4OH. The variation is small for the range of pH values in chronic wounds (pH 5.4 to 8.6). Also different acids and bases with same pH produce similar resistance change. (b) Conductivities of the solutions show different trend against pH as compared to resistance change.

