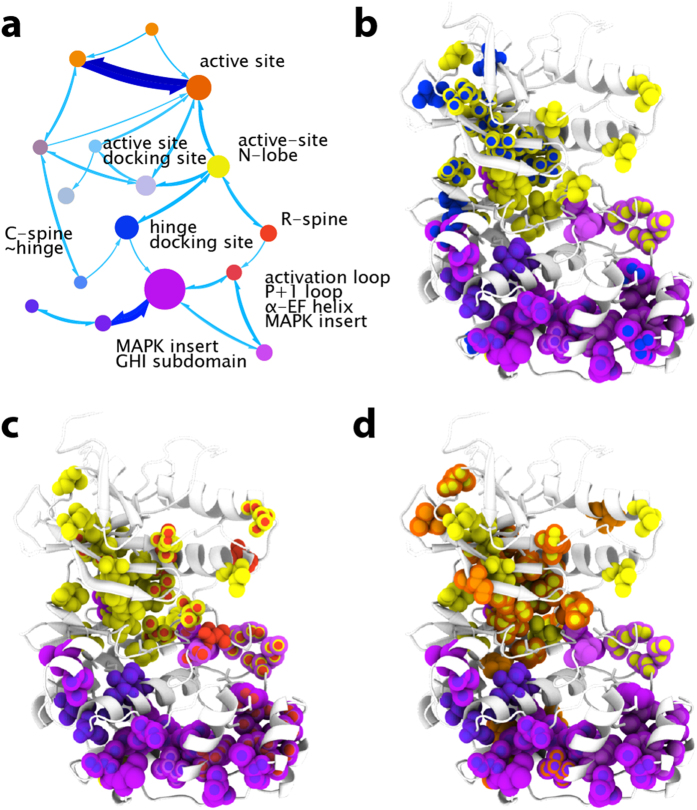
Figure 5. Network response to activation.
Network analysis identified 16 communities with membership greater than 5 residues in active p38γ. Communities are represented in shades of color based on tertiary structure and regulatory element: N-lobe/active-site, yellow; C-lobe/MAPK-insert/GHI subdomain, purple; active-site/GHI subdomain, orange; C-spine/hinge, blue; R-spine, red. The network map is depicted in (a) with flow and membership represented as in Fig. 3. Flux through communities connecting N and C-lobes are depicted: through the C-spine hinge (b), through the R-spine (c), and through the active site residues (d).

