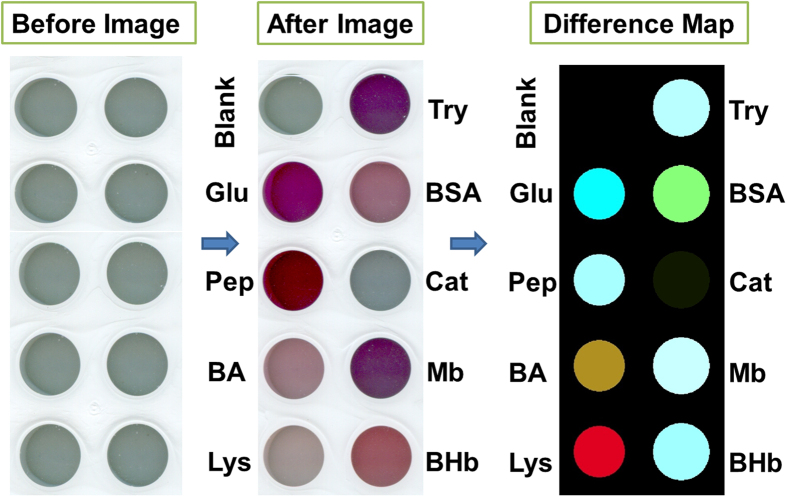
Figure 5. Color images of the Au(I) anions, luminol and H2O2 mixture in the absence (named “before” images) and presence (named “after” images) of proteins at 25 μg/mL.
For display purpose, the color ranges of the difference maps are expanded from 5 to 8 bits per color (RGB range of 4–35 expanded to 0–255).

