Figure 7.

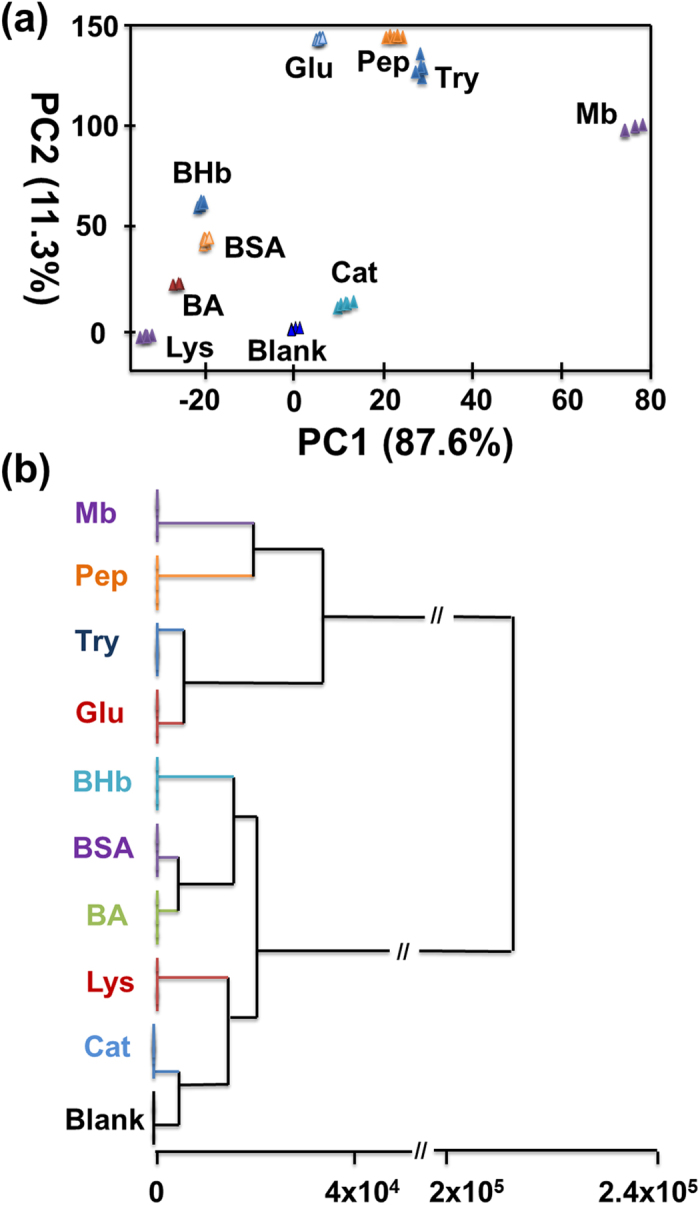
(a) Canonical score plots for the ΔRGB response pattern analyzed by PCA. (b) HCA analysis of the Au(I) anions, luminol and H2O2 mixture in the absence and presence of nine proteins (25 μg/mL) with five parallel measurements.

(a) Canonical score plots for the ΔRGB response pattern analyzed by PCA. (b) HCA analysis of the Au(I) anions, luminol and H2O2 mixture in the absence and presence of nine proteins (25 μg/mL) with five parallel measurements.