
Figure 2. Assessing the relevance of the PCSF solutions to GBM.
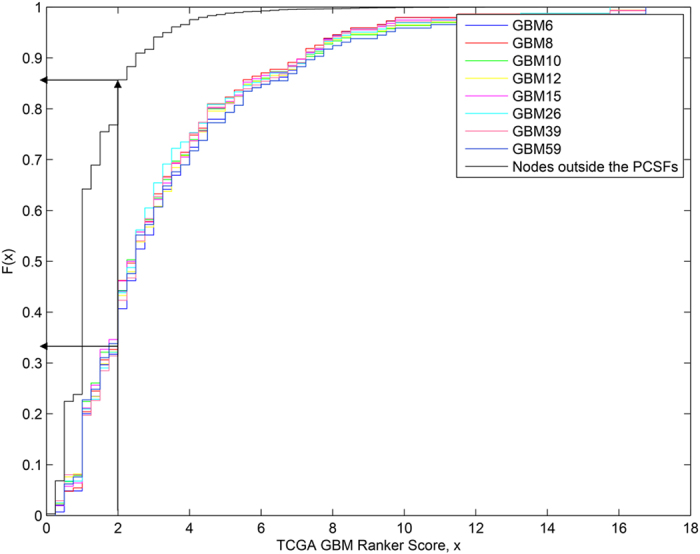
The cumulative distribution function is plotted for the GBM GeneRanker scores for each tumor line and for the nodes outside the PCSFs. (Higher scores indicate greater evidence of association with GBM.) As the arrows point out, the probability of having a score less than 2.0 for proteins within the disease network is 0.35 on average while this probability is 0.85 for the nodes outside the PCSFs.