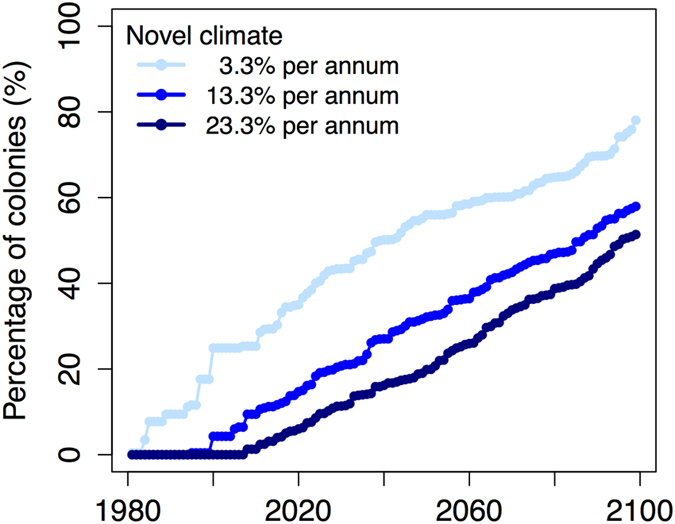
Figure 5. Percent of Adélie penguin breeding colonies experiencing different rates of novel climate, accounting for different colony sensitivity.

Each line is the average of satellite observations from 1981–2010 and the global climate model ensemble from 2011–2099.
