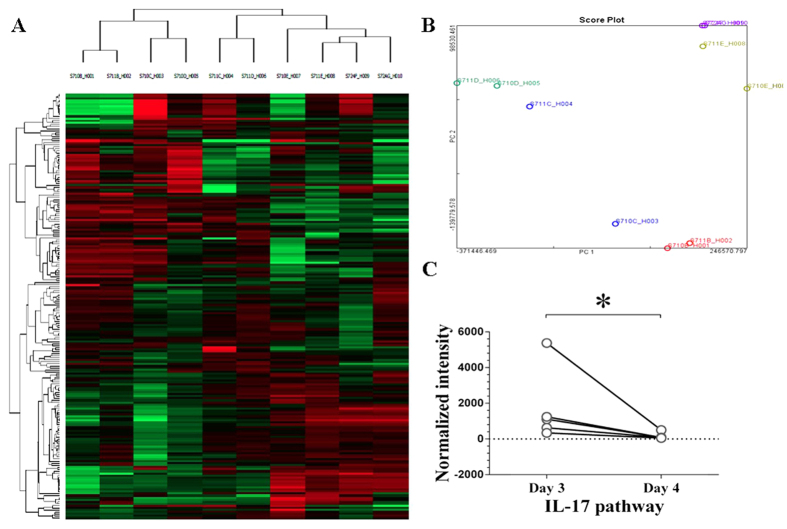
Figure 4. Gene expression profiling.
(A) Clustering analysis. Clustering was performed to visualize the correlations among the replicates and varying sample conditions. Up- and down-regulated genes are represented in red and green colors, respectively. (B) PCA plot. The variable of the first three principal components (PC1, PC2, PC3) for this study are 71.41%, 13.47%, and 5.90%, respectively. (C) Downregulated IL-17 pathway. *P < 0.05.

