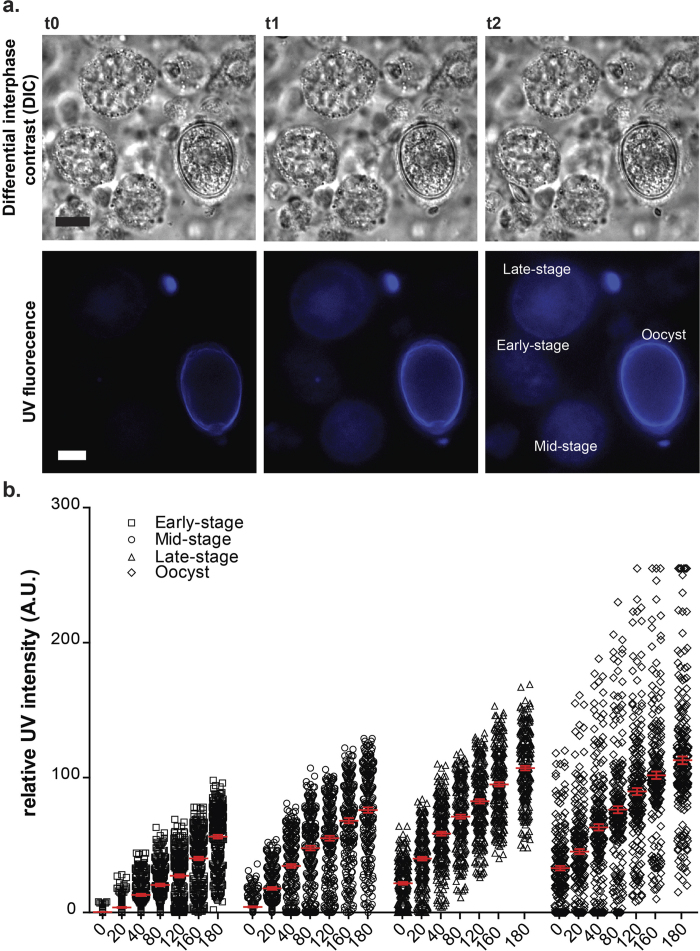
Figure 1. Live cell filming of freshly harvested gametocytes.
(a) Micrographs of three time-points from a 3 hour time-lapse sequence of freshly extracted sexual stages that were acquired every 10 minutes using a combination of differential interference contrast DIC (top) and fluorescence microscopy (bottom). The cells were exposed to UV light (ex: 385 nm) to reveal the distribution of autofluorescent proteins in the macrogametocytes at early-, mid-, and late-stages of development, and in forming tissue oocysts. Note the presence of autofluorescing material in the wall of tissue oocyst at t0. As the sequence progresses, the macrogametocytes begin to exhibit blue autofluorescence (t1), at a different rate, which initially appears concentrated in the central cytoplasm, and spreads outwards to cover the entire macrogametocyte (t2). (b) Increase in blue autofluorescence intensity over time in live sexual stages. Autofluoresence intensities were measured by a monochromatic detector, CCD camera and ex: 385 nm. High resolution temporal information and relative intensity were recorded and time points 0, 20, 40, 80, 120, 160 and 180 minutes plotted. Scale bar = 5 μm. See also Movie 1 for a complete time-lapse experiment.

