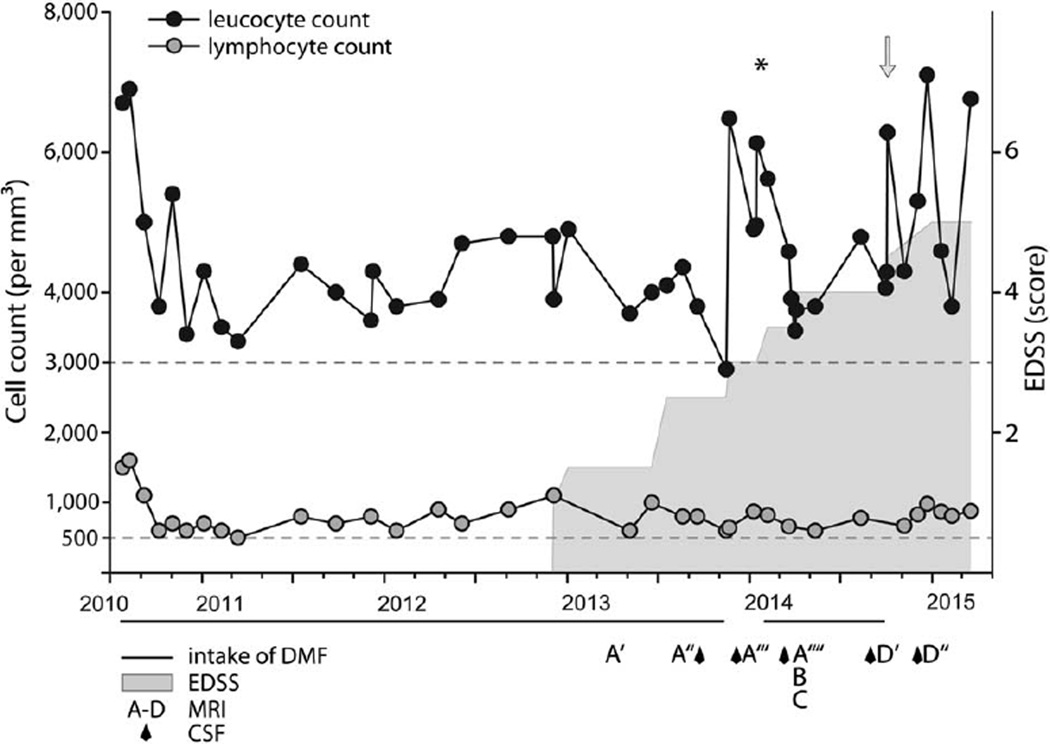
FIGURE 2.
Lymphocyte and leukocyte counts in relation with fumarate treatment and beginning of neurologic symptoms. Black circles = leukocyte count (per mm3); gray circles = lymphocyte count (per mm3); gray horizontal line = intake of Fumaderm tablets. Each tablet contains 120mg dimethyl fumarate (DMF) + 95mg monoethyl hydrogen fumarate. At the beginning of treatment in July 2010 and February 2014, fumaric acid was uptitrated using the established scheme to 5 × 120mg DMF + 95mg monoethyl fumarate daily. Gray area indicates onset and development of neurological disability over time using the Expanded Disability Status Scale (EDSS) score (for scaling, see y-axis). Asterisk indicates time point of intravenous treatment with cortisone (1,000mg/day for 5 days). Arrow indicates time point of brain biopsy. A–D = time point of magnetic resonance imaging (MRI) as shown in Figure 1 (another 4 MRIs are not shown). Diamonds indicate time points of cerebrospinal fluid (CSF) exams.

