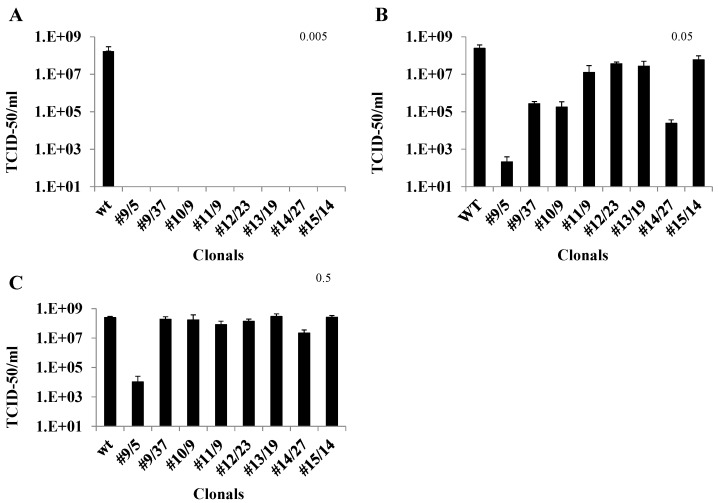
Figure 4.
TCID50-IFA analysis of transformed Vero cell clones challenged with three different multiplicity of infections (MOIs) of CHIKV. (A) Challenge MOI of 0.005, and stained with anti-CHIKV antibody at 3 dpi; (B) Challenge MOI of 0.05, analyzed at 2 dpi. (C) Challenge MOI of 0.5, analyzed at 2 dpi. Each bar represents an average CHIKV titer obtained from three independent infections. Statistically significant differences were determined relative to the infected control sample (wt) using one-way ANOVA (GraphPad prism 6.0 software, Dunnett’s, p < 0.01). Error bars show the standard deviation among the three replicates for each clone. Individual clones are designated as hRz number/clone number.

