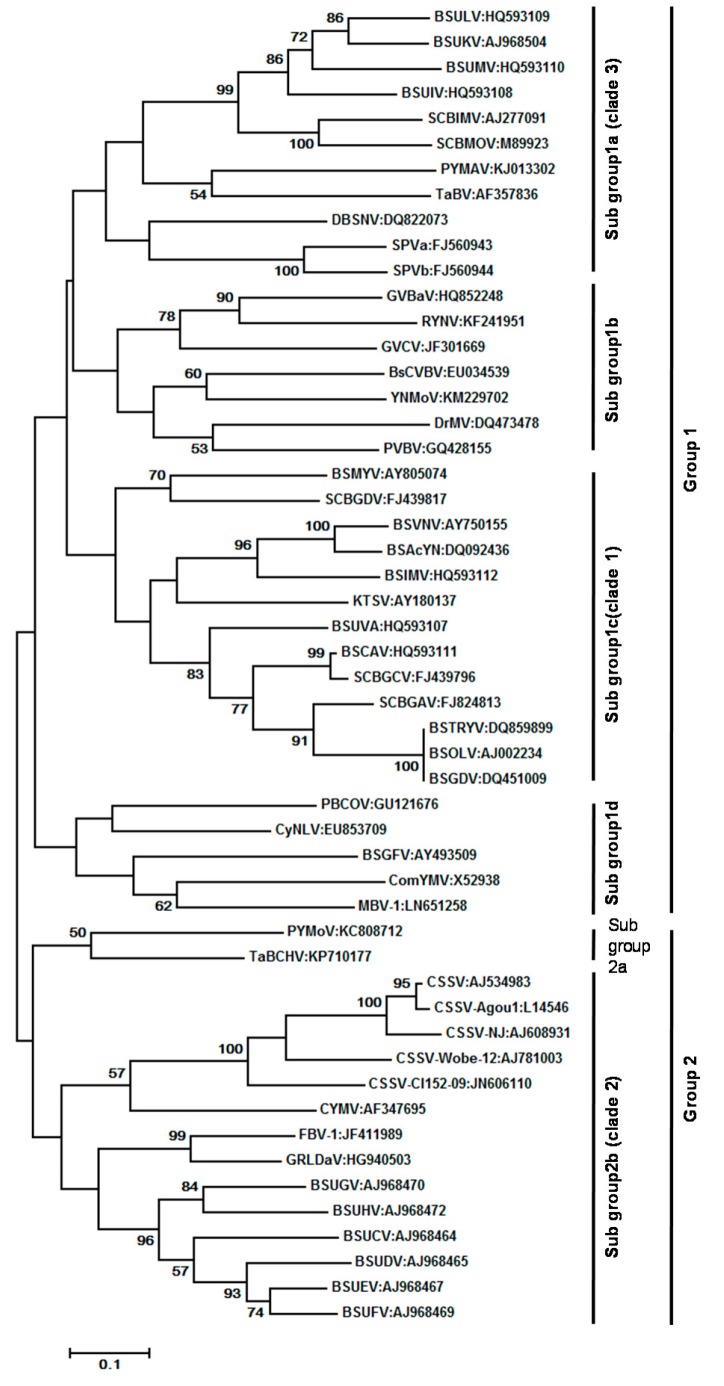
Figure 6.
Maximum likelihood phylogeny of 52 badnavirus isolates representing different species based on alignment of a 540-bp fragment of the RT/RNase H viral region. Bootstrap values of 1000 replicates are given when >50%. The tree is drawn to scale, with branch lengths measured in the number of substitutions per site. Details of acronyms used are provided in Supplementary Materials Table S1. The GenBank accession numbers of sequences are given in parentheses. Clades 1, 2, and 3 shown in the figure areas per the phylogeny analysis [46].

