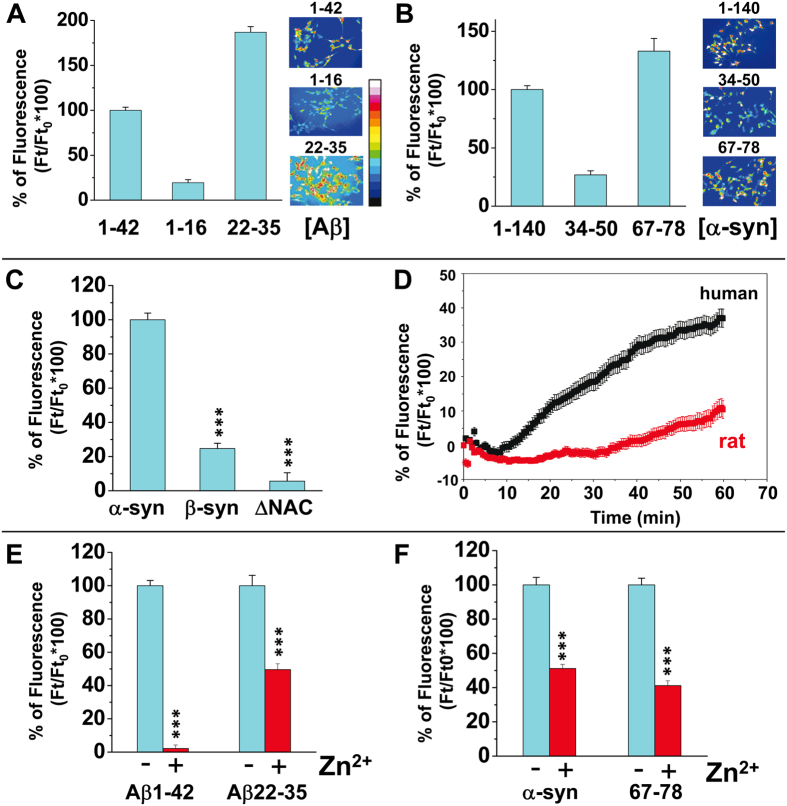
Figure 2. Amyloid pore formation induced by full-length and lipid-binding domains of Aβ1-42 and α-synuclein.
SH-SY5Y cells were preloaded with Fluo-4AM, rinsed three times and then incubated with 220 nM of Aβ1-42, Aβ1-16 or Aβ22-35 (A), α-synuclein1–140, α-synuclein34–50 or α-synuclein67-78 (B), Δ-NACα-synuclein or β-synuclein (C) proteins/fragments. The histograms show the mean intensity (±SEM) of the specific Ca2+ response measured after 60 (Aβ proteins) or 75 min (synucleins) of incubation (basal Ca2+ fluxes did not exceed 5% of the response and were subtracted from all values). The images in panels A and B show pseudocolor representations of cells at the end of the incubation with the protein (scale in panel A). (D) Kinetics of intracellular Ca2+ concentrations upon treatment with rat (red curve) or human (black curve) Aβ1–42. (E,F) Effect of the amyloid pore inhibitor Zn2+ on Ca2+ fluxes induced by Aβ (E) or α-synuclein (F) proteins. Student’s t-test was used to assess the statistical significance of Ca2+-dependent fluorescence between control (full-length Aβ1-42 and α-synuclein) and each experimental condition (e.g. β-synuclein or ±Zn2+) α-synuclein and β-synuclein (***p < 10−4 with 45 < n < 145).

