Figure 2.
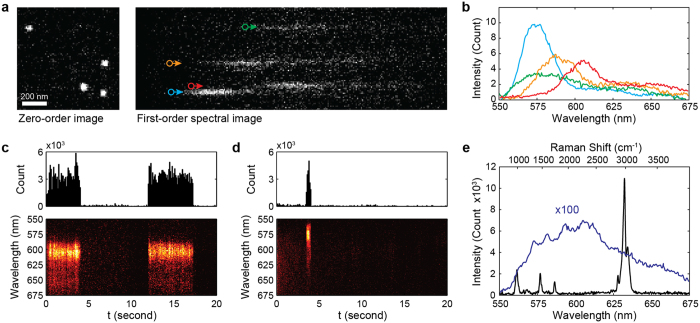
(a) A representative frame collected by the EMCCD for spectroscopy. Image was separated according to the diffraction order of the grating. (b) Fluorescence spectra of individual blinking events denoted by colored circles in (a). (c) Shows the emission from long-lived blinking events at a single location and the respective spectra in time. The spectra and photon count were consistent for each consecutive flashing event. Blinking from short-lived events (d) also had consistent spectra for each location, however, they were comparatively narrower and blue-shifted in PMMA. For longer integration times, Raman background was more dominant than blinking event intensities (e). Therefore, to obtain accurate blinking emission spectra, the stochastic emission was summed over 1,000 consecutive frames and multiplied by 100 for comparison.

