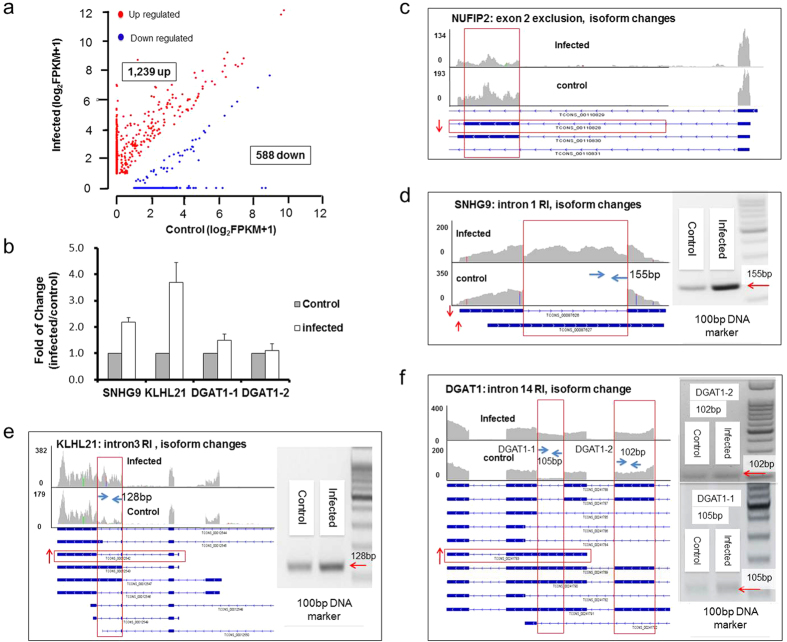
Figure 4. Isoform changes in HSV-1 infected BJ cell transcriptome.
(a) Scatterplot of log2(FPKM+1) values for isoform changes in non-infected samples (x-axis) and infected samples (y-axis). Genes with isoform changes of at least 2-fold (FPKM ≥ 1, p_value ≤ 0.05) was plotted. A total of 1,827 significant isoform changes were found with 1,239 gene isoforms showing increase of expression (red dots) and 588 showing reduction (blue dots) after infection. (b) qRT-PCR validation of SNHG9, KLHL21 and DGAT1 genes changes after infection. Two primer pairs (DGAT1-1 and DGAT1-2) were used to determine the change of DGAT1 isoform 00241783. The DGAT1-1 primer can identify 00241783, 00241789, 00241790 and 00241791 isoforms. The DGAT1-2 primer can identify 00241787, 00241788, 00241789, 00241790 and 00241791 isoforms. By comparing the products of DGAT1-1 and DGAT1-2 primer pairs, we can see there is a real increase of isoform 00241783 after infection other than a combined effect of serval isoforms. All data are normalized to 18S rRNA and presented as means ± standard deviation from three independent biological experiments. (c–f) Examples of genes with isoform changes. Arrows indicate either the increase or decrease of specific isoforms. Vertical boxed area showed increase of reads after the infection. RT-PCR validation of NUFIP2 showed in Fig. 2f, others showed beside RNA-seq visualization data respectively. Y-axis shows the number of mapped reads.

