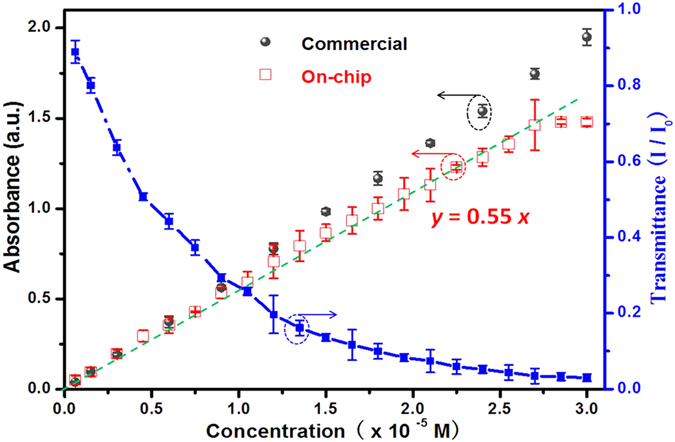
Figure 3. Calibration of the concentration measurement using the standard methylene blue solution samples.

The black round points represent the absorption results given by the commercial UV-Vis spectrophotometer, while the red half hollow square points by our device. The corresponding transmittance is also plotted using the blue solid square points. a.u. denotes arbitrary unit. I is the transmitted intensity, and I0 is the incident intensity.
