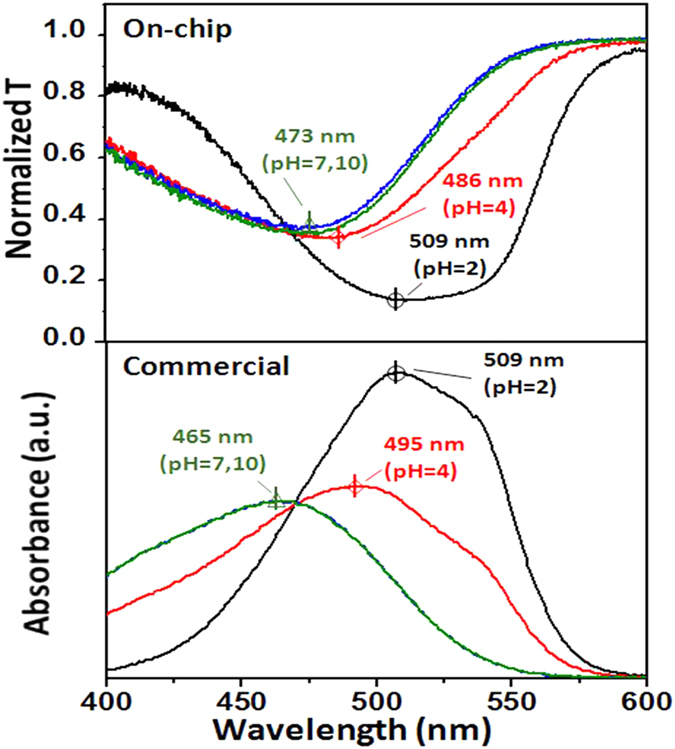
Figure 5. Comparison of the spectral features of methyl orange at different pH values.

Upper panel: transmission spectra measured by the on-chip UV-Vis spectrophotometer. Lower panel: absorption spectra measured by the commercial equipment. a.u. denotes arbitrary unit.
