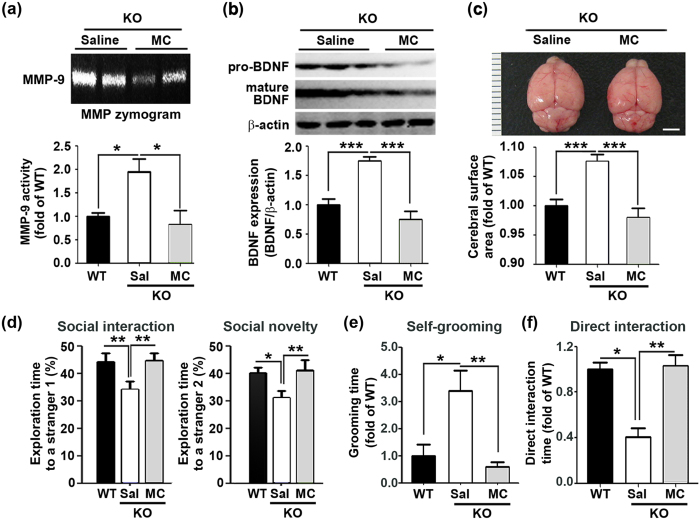
Figure 7. Minocycline reduces MMP activation, BDNF upregulation, and megalencephaly, and ameliorates autistic-like behaviors in male ZnT3 null mice.
(a) MMP gel zymograms. Treatment with MC markedly reduced MMP-9 activity. Bars denote fold increases in MMP-9 activity, as measured by densitometry on these gels (mean ± SEM, WT, n = 6; KO-Saline, n = 7; KO-MC, n = 3, *p < 0.05; one-way ANOVA with Tukey’s post hoc test). (b) Western blot analysis of BDNF levels. Treatment with MC substantially reduced BDNF levels in male ZnT3 null brains. Bars denote fold increases in BDNF levels, as measured by densitometry on these gels (mean ± SEM, WT, n = 4; KO-Saline, n = 8; KO-MC, n = 6, *p < 0.05, **p < 0.01; one-way ANOVA with Tukey’s post hoc test). (c) Photographs show representative brains from male ZnT3 null mice that were saline-treated or MC-treated. Note that treatment with MC resulted in a reduction of brain size. Bars denote the size of the cerebrum (mean ± SEM, WT, n = 13; KO-Saline; n = 9, KO-MC; n = 8, **p < 0.01; one-way ANOVA with Tukey’s post hoc test). Scale bar = 3 mm. (d) Bars represent time spent with a stranger 1 or with a stranger 2 in the 3-chamber test. The interaction with stranger 1 was greater in 50 mg/kg MC-treated ZnT3 null mice than in saline-treated ZnT3 null mice. The interaction with stranger 2 was greater in the MC-treated group than in the saline treated ZnT3 null mice group (mean ± SEM, WT, n = 19; KO-Saline, n = 27; KO-MC, n = 14, *p < 0.05, **p < 0.01; one-way ANOVA with Tukey’s post hoc test). (e) Bars represent time spent on self-grooming in the 3-chamber test. Self-grooming of ZnT3 null mice was significantly increased compared with WT mice and it was reduced by MC administration (mean ± SEM, WT, n = 7; KO-Saline, n = 12; KO-MC, n = 8, *p < 0.05, **p < 0.01; one-way ANOVA with Tukey’s post hoc test). (f) Bars represent time spent in direct interaction with stranger 1 mouse in the 3-chamber test. The direct interaction time was greater in MC-treated ZnT3 null mice than in saline-treated ZnT3 null mice (mean ± SEM, WT, n = 6; KO-Saline, n = 10; KO-MC, n = 8, **p < 0.01; one-way ANOVA with Tukey’s post hoc test).

