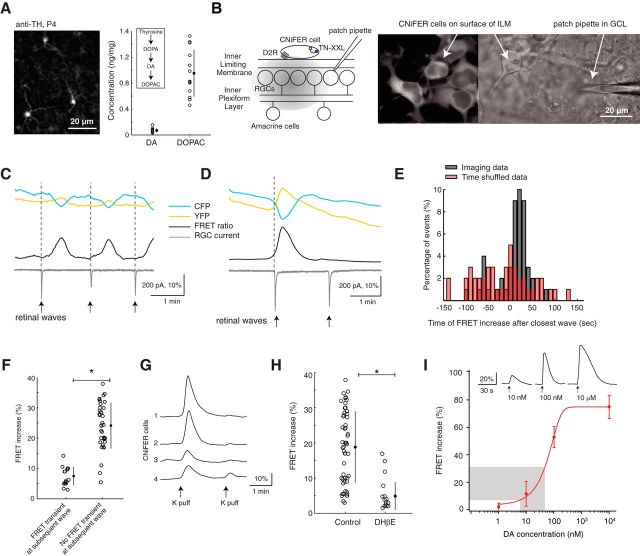
Figure 5.
Retinal waves stimulate diffuse dopamine release. A, Left, Fluorescent image of dopaminergic amacrine cells labeled by anti-TH in a P4 whole-mount retina. Right, Concentrations of DA and its primary metabolite DOPAC in P4–P6 retinas detected using HPLC. Each data point indicates a different retina. B, Left, Schematic of CNiFER experimental setup: CNiFER cell deposited on surface of inner limiting membrane and simultaneous patch-clamp recording from nearby RGC (see Materials and Methods). TN-XXL, Calcium-dependent FRET sensor; D2R: Type 2 dopamine receptor. Right, Fluorescent and DIC images of CNiFERs on surface of whole-mount retina. C, Example traces of CNiFER imaging and simultaneous voltage-clamp recording from an RGC showing three consecutive FRET events: FRET ratio (black, YFP/CFP); current trace (gray) from nearby RGC. Large EPSCs in RGC trace are associated with retinal waves (arrows). D, Example traces of CNiFER imaging and simultaneous voltage-clamp recording from an RGC where retinal wave is not associated with a FRET event. Details as in C. E, Times of a transient FRET increase after the closest wave-associated EPSC for observed data (black) and for time-shuffled data (red; see Materials and Methods). F, Magnitude of a FRET response when subsequent wave is (as in C) versus is not (as in D) associated with a FRET event. When the FRET event is absent for a wave, the FRET event evoked by the previous wave is large in magnitude. *p < 0.05 (two-tailed Student's t test). G, Example FRET traces of CNiFER responses from four different cells in the same field of view to a 0.5 s puff of high-potassium solution (K-puff) applied to the inner nuclear layer to stimulate dopaminergic amacrine cells. Response to the second K-puff is not detected whether the first FRET increase is greater than around 10%. H, FRET increases of transient events recorded in ACSF (control) and DHβE. *p < 0.05 (two-tailed Student's t test). I, Dose–response curve of DA-CNiFERs deposited on the inner limiting membrane surface to nearby DA puffs of known concentration. Inset, Example responses. Gray region represents range of magnitudes of spontaneous FRET increases observed in our recordings. Error bars indicate SD around the mean.

