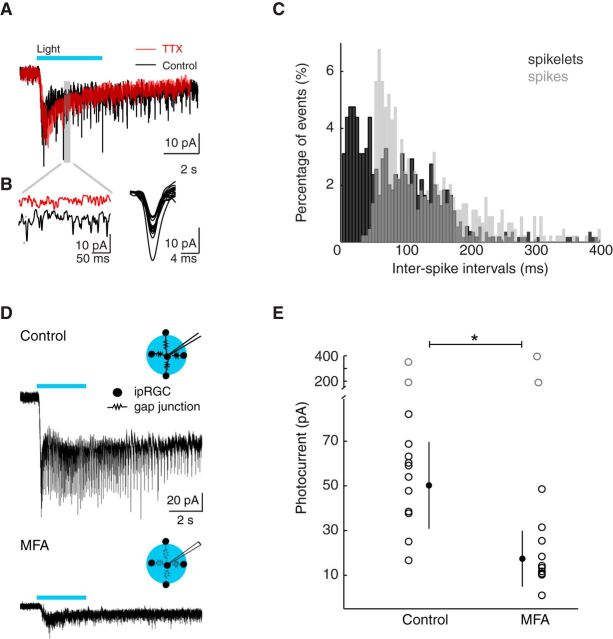
Figure 7.
Gap junction networks contribute to ipRGC photocurrents. A, B, Whole-cell voltage-clamp recording of ipRGC during 3 s blue light illumination in ACSF (control, black) and 1 μm TTX (red). B, Left, Shaded region is expanded. Right, Fifteen sample spikelets are displayed. C, Distribution of interspike intervals for spikelets during the 10 s following light onset (black) and of interspike intervals for spikes recorded in cell-attached configuration (gray). D, Top, Diagram of setup illustrates that wide-field illumination stimulates multiple gap junction-coupled ipRGCs in the field of view. Bottom, Example traces of ipRGC photocurrents in response to 3 s blue light illumination in control and in the gap junction blocker MFA (50 μm, 30 min). E, Peak photocurrent amplitude for control and MFA groups. Error bars indicate SD around the mean. *p < 0.05 (two-tailed Student's t test). Gray circles were considered a different cell population and thus were not included in the analysis.

