
Figure 1.
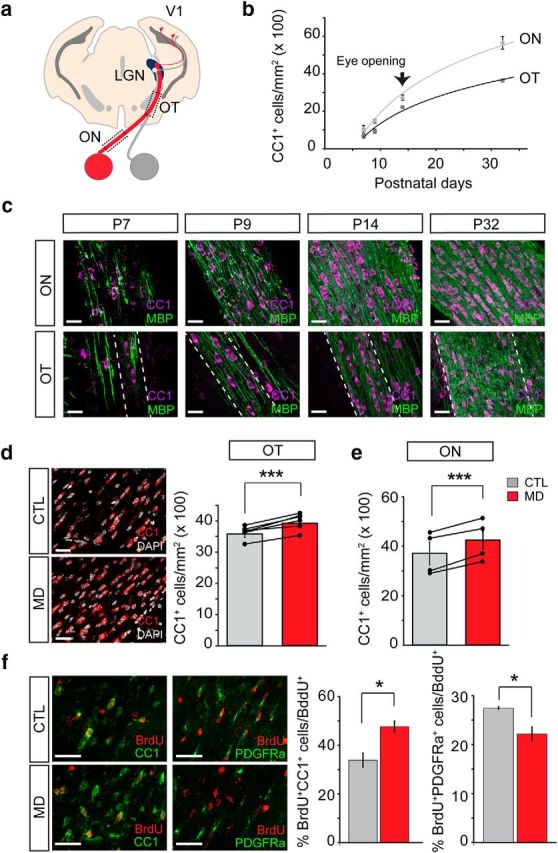
MD increases oligodendrogenesis. a, Schematic diagram of a brain section depicting the visual system. The axons of ganglion cells exit the eye via the ON, partially cross at the optic chiasm, and project to the contralateral and the ipsilateral LGN through the OT. The LGN receives input from both eyes and relays these messages to the primary visual cortex (V1). b, CC1+ mature oligodendrocyte density in the mice ON and OT (15 μm stack) during the first postnatal month. Eye opening takes place after the second postnatal week. c, Representative images of CC1+ (magenta) OLs and myelin staining (MBP, green) at different postnatal ages in the ON and OT. d, Mice were subjected to long-term MD from P15 to P32, and the contralateral deprived or ipsilateral control OTs were analyzed. Left, Representative coronal brain slice images of CC1 (red, mature oligodendrocytes) and DAPI (white, nuclear staining) immunostaining in control and monocularly deprived OT. Right, Quantification of the number of CC1+ cells in the contralateral and ipsilateral OT of MD mice (CTL = 35 ± 0.8 cells; MD = 40 ± 0.7; N = 6 mice; p = 0.001, paired t test). e, Quantification of the number of OLs in deprived and control ONs (CTL = 35.8 ± 4.5 cells; MD = 40.79 ± 3.45 cells; N = 4 mice; p = 0.007, paired t test). Black dots represent individual measurements. Lines connect CTL and MD measurements from the same animal. f, Monocularly deprived mice were injected with BrdU (100 μg/g) every day from P16 to P32, and the percentage of the cumulative proliferating mature oligodendrocytes (BrdU+/CC1+, CTL = 33.9%, n = 5 mice, MD = 47.7% n = 4 mice, p = 0.01, t test) and oligodendrocyte progenitor cells (BrdU+/ PDGFRα+, CTL = 27.5%, MD = 22.2%, p = 0.03, t test, n = 3 mice) in the deprived and control OTs was quantified. Scale bar, 30 μm. Data in bar graphs represent mean ± SEM. *p < 0.05, ***p < 0.001.