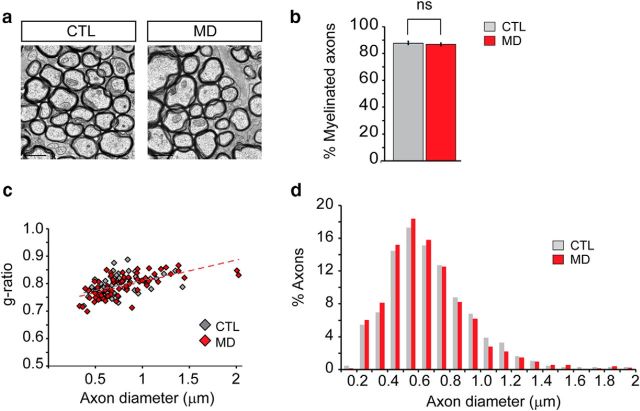
Figure 2.
MD does not alter ON ultrastructural properties. a, Representative TEM images of P32 control mouse ON or visually deprived nerve. Scale bar, 0.1 μm. b, The percentage of myelinated axons in electron microscopy images was quantified in both control and MD mice (CTL = 8 6.9 ± 0.9%, MD = 88 ± 1.1%, p = 0.47, n = 1350 axons). c, Scatter plots of g-ratio as a function of axon diameter in control and MD mice display no significant difference in myelin thickness (average g-ratio CTL = 0.79; MD = 0.79, n ≥ 70 axons). d, Comparison of axon diameter distributions in deprived and normal nerves showed no differences on axonal ultrastructure (average axon diameter CTL = 0.68 μm, MD = 0.65 μm, n ≥ 1440 axons). ns, Not significant.

