
Figure 3.
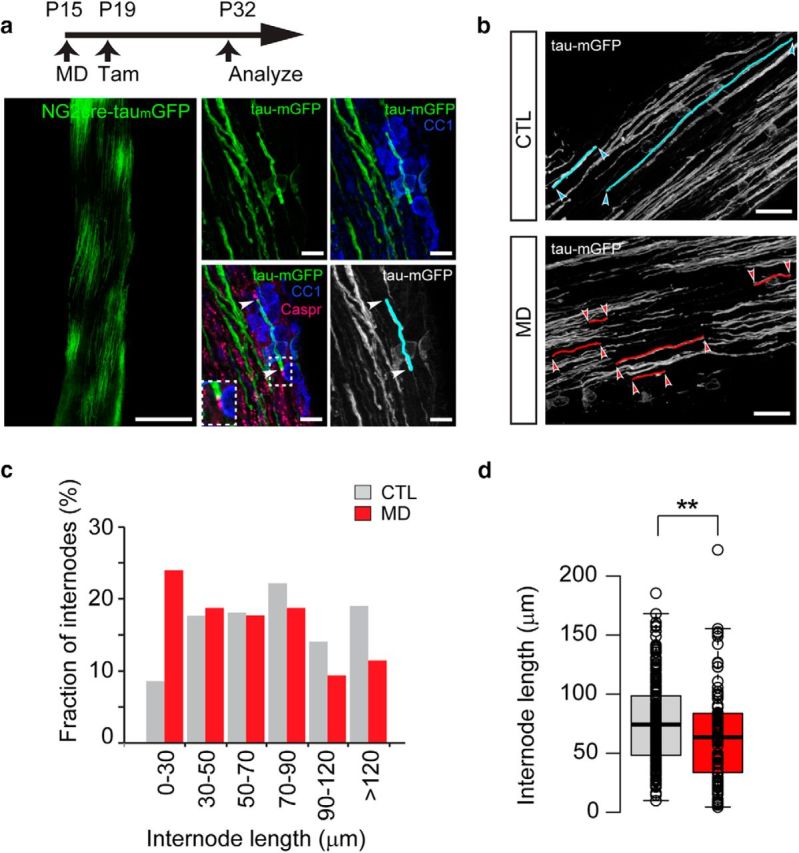
Visual experience regulates myelin internode length establishment during development. a, MD was performed in NG2-creERT2:tau-mGFP mice from P15 to P32 and new myelin generated during that period in the normal and deprived ON was labeled upon injection of tamoxifen at P19. Left, Representative low-magnification image of a longitudinal NG2-creERT2:tau-mGFP mice ON section at P32. Scale bar, 200 μm. Right, High-magnification images immunostained with CC1 (blue) show sparse labeling of mature oligodendrocytes (green) and immunostaining with Caspr (magenta) used to identify nodes of Ranvier (arrowheads). Myelin internodes were traced (cyan) and their length measured using NeuronJ plugin for ImageJ. Scale bar, 10 μm. b, Representative images of traced GFP+ myelin internodes in control (blue) and deprived (red) ONs of NG2-creERT2:tau-mGFP mice. c, Distributions of internode lengths for OLs born during MD in ONs from open and closed eyes. d, Box-plot of internode lengths measured from control and MD nerves. Center lines indicate the medians (CTL = 74.39 μm, n = 221 internodes from 8 mice; MD = 63.55 μm, n = 116 internodes from 7 mice; p = 0.008, Mann–Whitney U test). Box limits indicate the 25th and 75th percentiles. Whiskers extend to the 5th and 95th percentiles (Altman). Dots represent outliers. Open circles represent data points. **p < 0.01.