Figure 3.
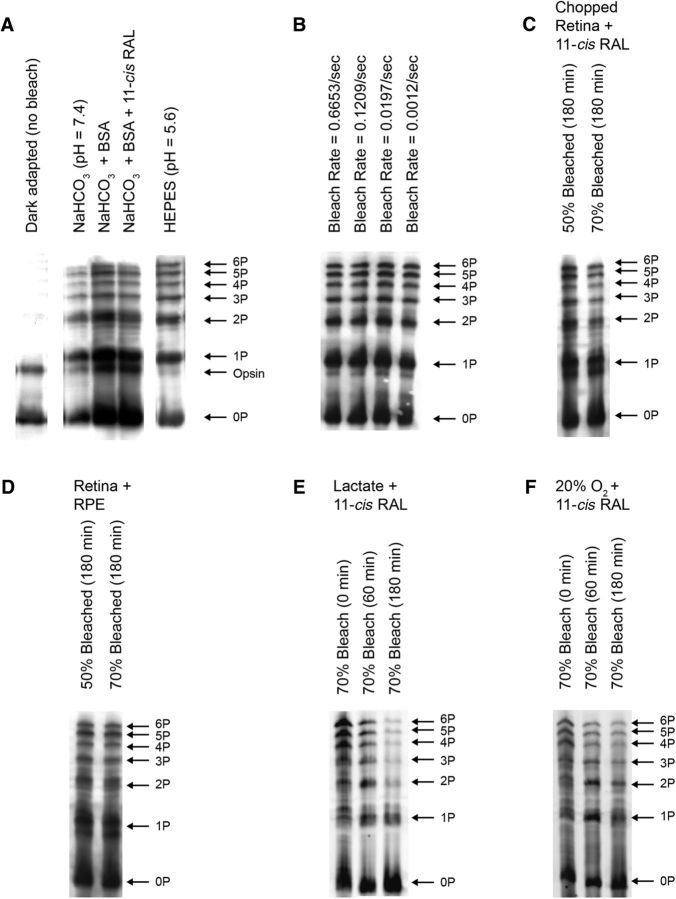
Opsin dephosphorylation in isolated retinae measured by IEF gels in different conditions. The gels show rhodopsin segregation based on the total number of attached phosphates as indicated in the right side of each series of gels. Except when noted, retinae were incubated in bicarbonate-buffered Ames medium under 95% O2/5% CO2. A, IEF gels measured after incubation in different conditions as indicated in the panel. The retinae were either dark adapted (left most lane) or bleached 70% and incubated in Ames medium in darkness for 180 min. The opsin band, representing the apoprotein attributable to incomplete regeneration with 11-cis-retinal, is sometimes observed in these gels. B, IEF gels of retinae that were bleached 70% at different bleaching rates (as indicated in the panel) and incubated in Ames medium in darkness for 180 min. C, IEF gels of retinae that were bleached 50 or 70%, chopped, and then incubated in Ames medium containing 11-cis-retinal in darkness for 180 min. D, Eyecups containing both the neural retina and RPE were bleached and incubated in darkness as in C. E, Retinae were incubated in Ames medium containing 4 mm Na l-lactate, bleached 70%, and immediately frozen (0 min) or frozen after incubated in darkness for 60 or 180 min. For each lane, signals from 1P to 6P were summed and divided by signals from all bands (0 to 6P) to obtain the fraction of phosphorylated rhodopsin in that sample. The value obtained for 0 min was 0.72 ± 0.04 (n = 8), corresponding well to the estimated 70% bleach, and 0.71 ± 0.07 (60 min, n = 4) and 0.44 ± 0.06 (180 min, n = 4). These values were subjected to one-way ANOVA. The p value for one-way ANOVA was 1.7 × 10⁻⁶, and the p value for Tukey's HSD was p < 0.002 for both 180 versus 0 min and 180 versus 60 min. F, Retinae were incubated with Ames medium (without added lactate) under 20% O2/5% CO2/75% N2 and subjected to bleach and dark incubation as described in E. The fractions of phosphorylated rhodopsin were 0.72 ± 0.04 (0 min, n = 8) and 0.73 ± 0.02 (n = 4) for 60 min and 0.64 ± 0.05 (n = 4) for 180 min. The one-way ANOVA showed a p value of 0.0049. This was followed by Tukey's HSD test, which showed a significant difference between 180 versus 0 min and 180 versus 60 min (p < 0.01 for both comparisons).

