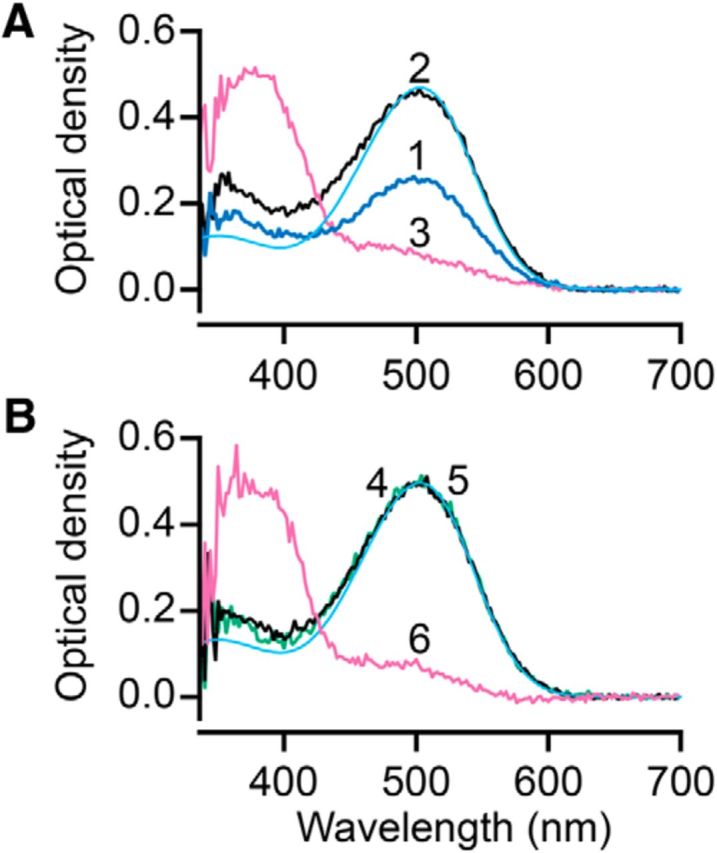
Figure 4.

MSP absorbance spectra of bleached and regenerated WT (C57BL/6) retinae. A, Absorbance spectrum of a retina that had been bleached 50% (trace 1, blue), then treated with 11-cis-retinal on the stage of the MSP for 40 min (trace 2, black), and finally after exhaustive bleach (trace 3, pink). The cyan trace is a normalized rhodopsin template (Govardovskii et al., 2000) calculated at λmax = 503 nm, ODα = 0.47. B, Trace 4 (green) shows an absorbance spectrum of a retina that had been bleached 50% and incubated for 3 h with 10 μm 11-cis-retinal in darkness in a light-tight incubation container. Trace 5 (black) shows an absorbance spectrum of the same preparation after 40 min additional exposure to solution containing 10 μm 11-cis-retinal on the stage of the MSP. Trace 6 (pink) shows absorbance spectrum after an exhaustive bleach (>99%). The cyan trace is a fitted rhodopsin template (λmax = 503 nm, ODα = 0.50).
