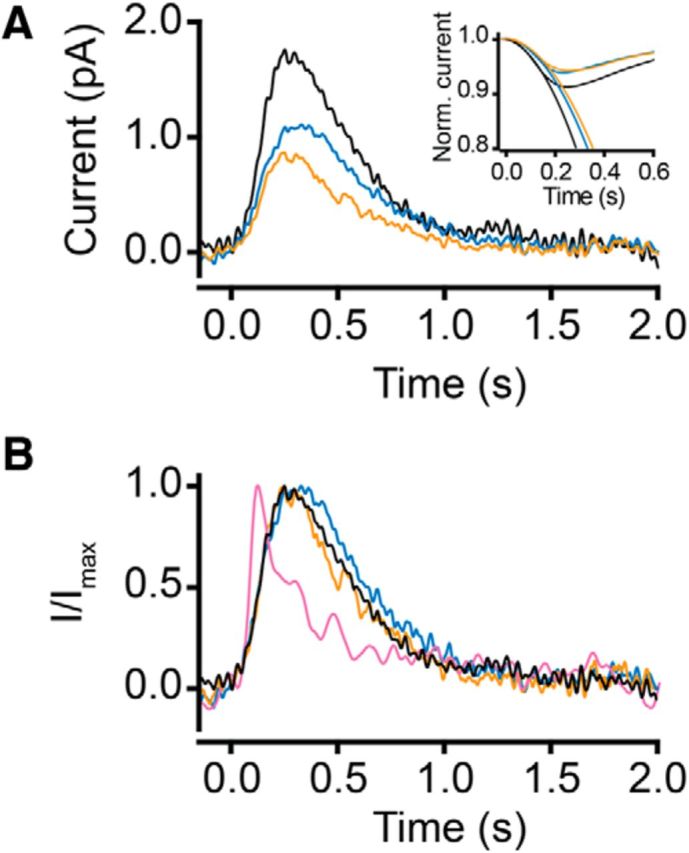
Figure 8.

Average SQR recorded from WT rods containing rhodopsin and phosphorylated rhodopsin. A, Representative SQRs from a rod containing rhodopsin (black), 50% phosphorylated rhodopsin (blue), and 90% phosphorylated rhodopsin (orange). Inset, Averaged, smoothed, and normalized SQRs fitted with an activation model (Pugh and Lamb, 1993). For details, see text. B, Normalized SQRs from A. Also shown is a normalized average dim flash response from a 50% bleached rod (pink). The recordings were made at 35–37°C.
