
Figure 1.
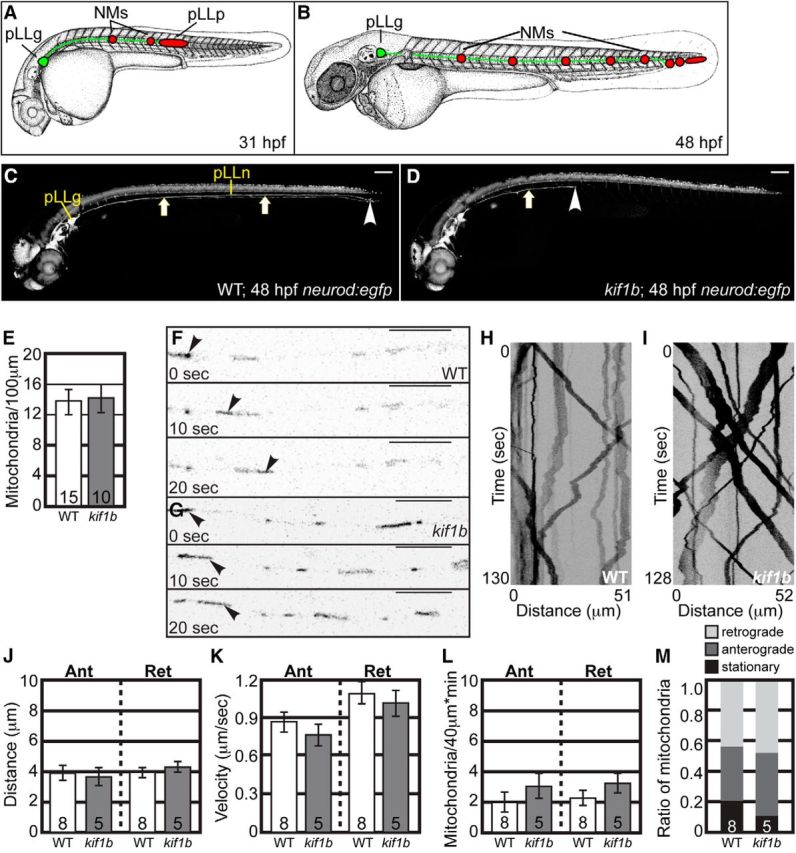
Mitochondrial transport is normal in kif1bst43 mutants. A, B, Schematic of pLL development. pLL pioneer axons (green) extend from neurons in the pLL ganglion (pLLg). The growth cones of pLL axons are embedded in the pLL primordium (red) which migrates along the trunk between 22 and 48 hpf. As it migrates, the pLL primordium deposits neuromasts (NMs; red) that will develop into the sensory organs of this system. Initial NM deposition and axon extension is complete by 48 hpf. C, D, Wild-type and kif1bst43 mutant neurod:egfp transgenic zebrafish embryos at 48 hpf. pLL axons (arrows) have fully extended by this time point in wild-types but fail to do so in kif1bst43 mutants. Scale bar, 100 μm. Arrowhead indicates the end of the nerve. E, Total mitochondria per 100 μm is unchanged with loss of Kif1B (ANOVA; p = 0.8776). F, G, Stills from Movies 1 and 2 showing mitochondrial transport in single pLL axons of wild-type (F) and kif1bst43 mutant (G) embryos between 24 and 28 hpf. Arrowheads point to a single mitochondria moving in the anterograde direction in each series. H, I, Kymographs of mitochondrial transport in wild-type (H) and kif1bst43 mutant (I) embryos. J, Distance of movement [ANOVA; Anterograde (Ant): p = 0.8426, Retrograde (Ret): p = 0.3128], (K) velocity of transport (ANOVA; Ant: p = 0.1664, Ret: p = 0.5649), (L) frequency of movement in either direction, and (M) mitochondrial population dynamics (ANOVA; Ant: p = 0.3520, Ret: p = 0.2734) are unchanged in kif1bst43 mutants. Numbers on graphs indicate sample size. Error bars represent standard error of the mean. Scale bars, 10 μm.