
Figure 5.
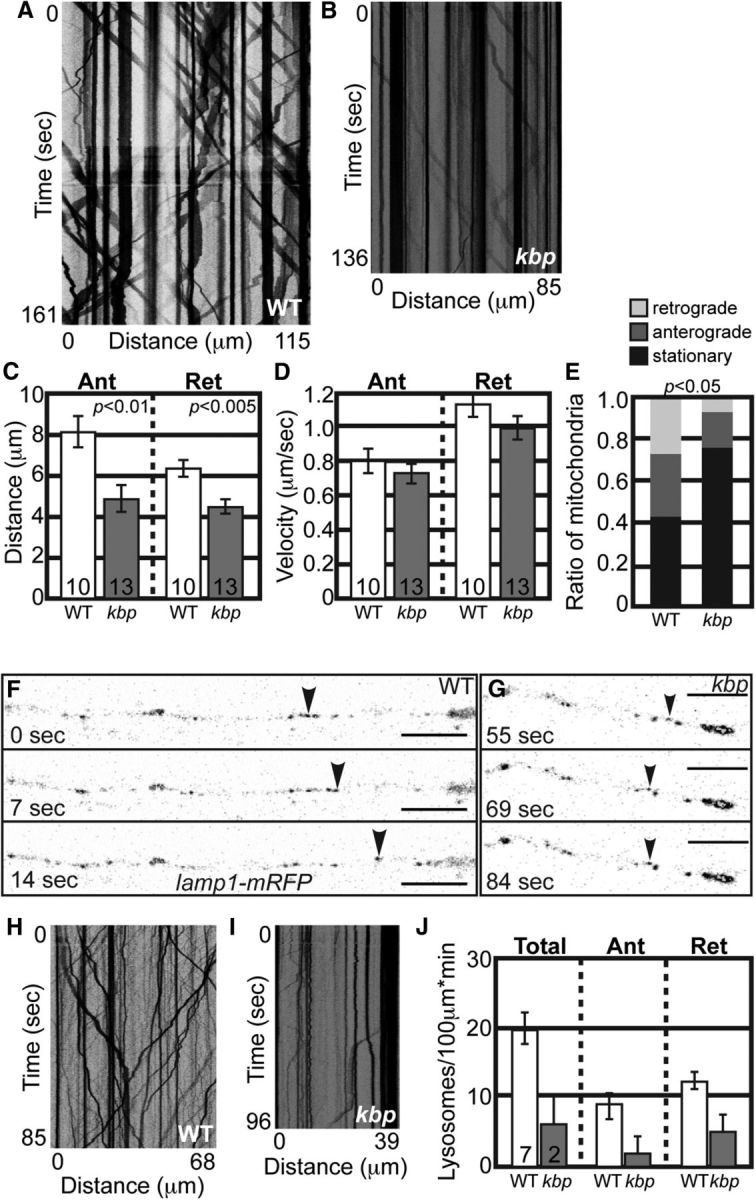
Mitochondrial and lysosomal transport is disrupted in kbpst23 mutants at 4 dpf. A, B, Kymographs representing mitochondrial transport in a wild-type (A) and kbpst23 mutant (B) at 4 dpf. C, Distance moved by mitochondria in both directions is decreased at 4 dpf (ANOVA). D, Velocity of transport is unchanged (ANOVA; Ant: p = 0.3971, Ret: p = 0.3275). E, Population dynamics show a shift to primarily stationary mitochondria at 4 dpf in kbpst23 mutants (ANOVA; p < 0.05). F, G, Stills from imaging sessions analyzing Lamp1-mRFP transport in a kbpst23 mutant (G) and a wild-type sibling (F) at 4 dpf. H, I, Kymographs representing lysosome transport. J, Total lysosome number and the number moving in either direction are decreased in kbpst23 mutants. There were too few moving lysosomes to calculate statistics of transport parameters, including distance and velocity of movement. Error bars represent standard error of the mean. Scale bars, 10 μm.