Fig. 5.

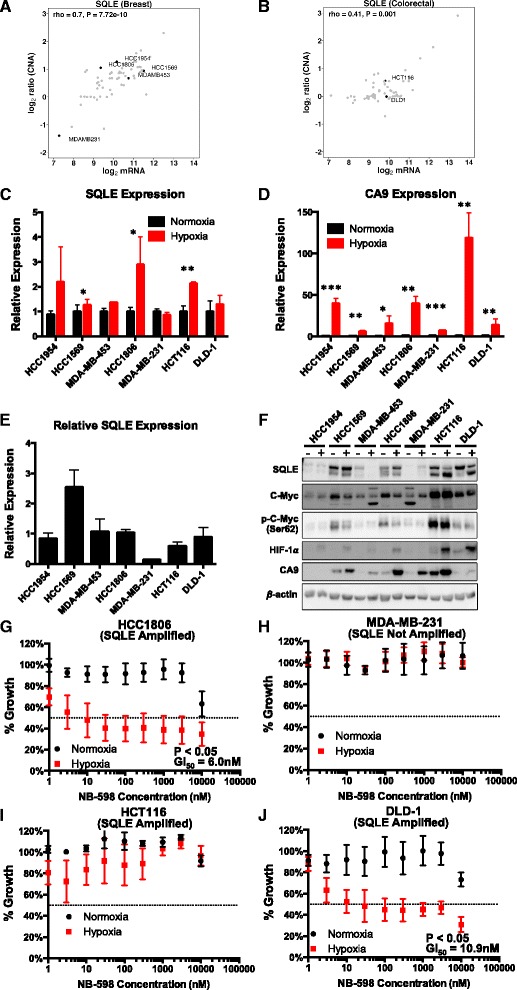
In vitro validation of SQLE is normoxia and hypoxia. a SQLE expression and copy number correlation in CCLE breast cancer lines. Cell lines used for in vitro validation are labelled. b SQLE expression and copy number correlation in CCLE colorectal cancer lines. Cell lines used for in vitro validation are labelled. c SQLE expression in cancer cell lines under 24-h normoxia and hypoxia (1 % O2). d CA9 expression (hypoxia control) in cancer cell lines under 24-h normoxia and hypoxia (1 % O2). e SQLE expression in cancer cell lines relative to one another. f Western blot analysis showing the levels of SQLE, MYC, phospho-MYC (Ser62), HIF-1α and CA9 after 24 h of normoxia and hypoxia (1 % O2). The two SQLE bands correspond to different isoforms, which were further confirmed by siRNA knockdown western blots (Additional file 1: Figure S11q). g–j SQLE inhibition with NB-598 reduces cell viability at a range of concentrations with a GI50 of 6 nM in HCC1806 (g) and GI of 10.9 nM in DLD-1 (j) under hypoxia (1 % O2) but not normoxia. The effect of the compound was not inhibitory enough to calculate a GI50 value in MDA-MB-231 (h) or HCT116 (i) cells under normoxia or hypoxia (1 % O2). HCC1954 and HCC1569 are HER2+ breast cancer cell lines. MDA-MB-453, HCC1806 and MDA-MB-231 are triple receptor negative breast cancer cell lines. HCT116 and DLD-1 are colorectal cancer cell lines. Error bars are standard deviations. ***P < 0.001, **P < 0.01, *P < 0.05, n = 3
