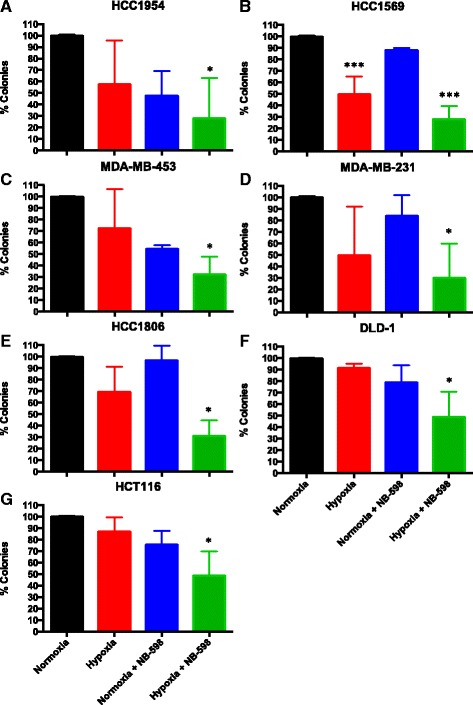
Fig. 6.

Clonogenic analysis of SQLE. a–g Clonogenic analysis of SQLE inhibition by NB-598 under normoxia and hypoxia (1 % O2) in HCC1954 (a), HCC1569 (b), MDA-MB-453 (c), MDA-MB-231 (d), HCC1806 (e), DLD-1 (f) and HCT116 (g) cells. ***P < 0.001, *P < 0.05, n = 3. Black, red, blue and green bars correspond to the percentage of colonies under normoxia and hypoxia and NB-598 cells under normoxia and hypoxia, respectively. Error bars are standard deviations
