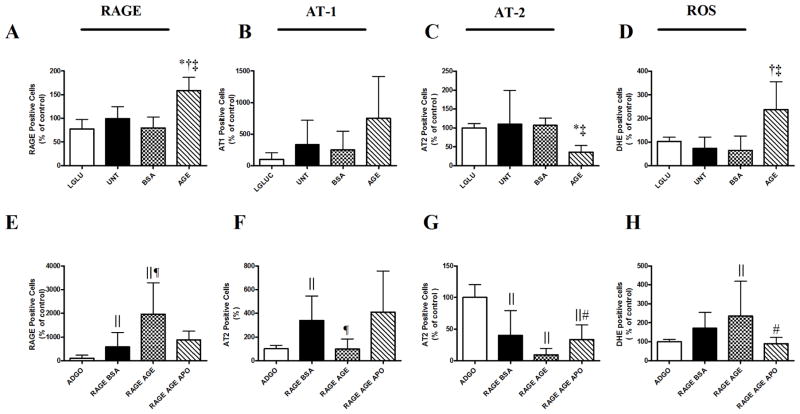
Figure 5. AGE-RAGE interactions modulate AT-2 receptor expression in primary mesangial cells.
(A–D) Primary mesangial cells were treated with 100μg/mL AGE-BSA. Data is representative of duplicate experiments (n=3–4/group/experiment). (A) Cell surface RAGE (B) AT-1 (C) and AT-2 receptor expression by flow cytometry. (D) Intracellular ROS production was measured by DHE and flow cytometry. (E–H) Mesangial cells were infected with an adenovirus overexpressing human full length RAGE and treated with/without 100μg/mL BSA or AGE-BSA. Cells were analysed by flow cytometry for the cell surface expression of (E) RAGE, (F) AT-1, (G) or the AT-2 receptor in addition to (H) intracellular ROS production. Data presented as mean ± SD. L-GLU – 25mM L-glucose control, UNT – untreated cells cultured in 25mM D-glucose, ADGO – adenoviral empty vector control RAGE BSA – cells infected with RAGE adenovirus and treated with BSA, RAGE AGE – Cells infected with RAGE adenovirus and treated with AGE-BSA, RAGE AGE APO – Cells infected with RAGE and treated with AGE-BSA in the presence of 1μM Apocynin *p<0.05 vs L-GLU, †p<0.05 vs UNT, ‡p<0.05 vBSA §p<0.05 vs AGE-BSA, ||p < 0.05 vs ADGO, ¶p < 0.05 vs RAGE BSA, # p < 0.05vs RAGE AGE BSA.

