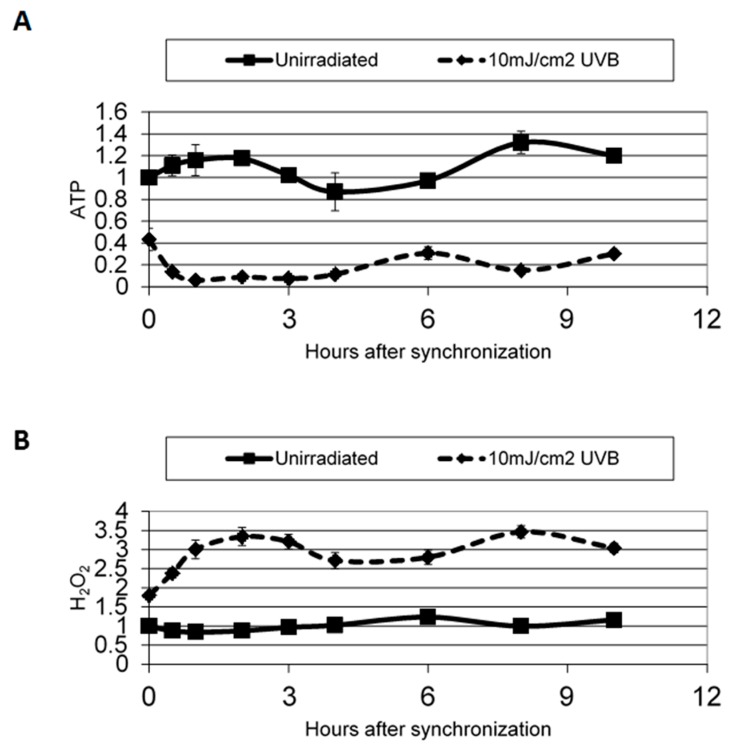
Figure 4.
ATP (A) and H2O2 (B) levels after release from starvation in irradiated and non-irradiated cells. ATP and H2O2 levels were measured at several time points after being released from starvation. ATP and H2O2 levels are shown as relative to the level at 0 h. ATP and H2O2 rhythmicity is lost after UV irradiation. Error bars are standard error measurements. Used with permission, Experimental Dermatology, Dong et al. [60].

