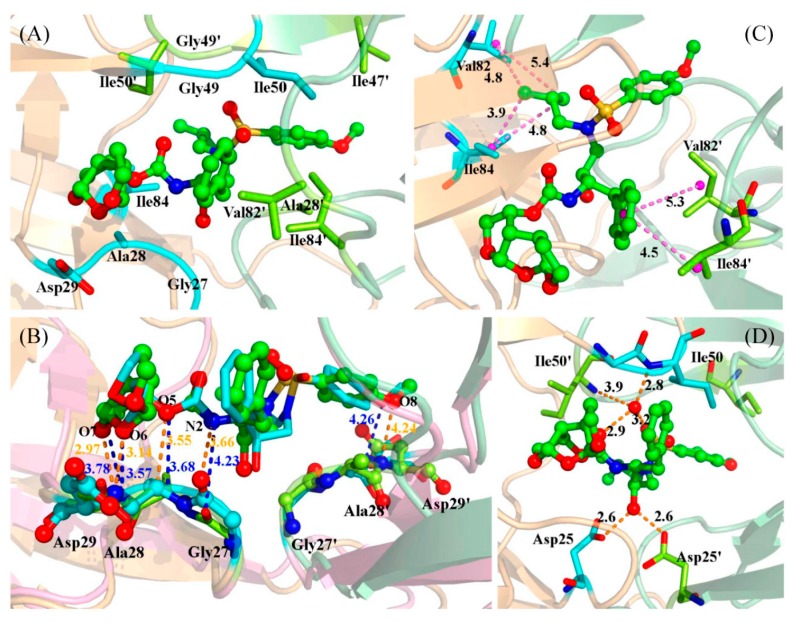
Figure 5.
(A) Key residues interacted with the inhibitor in the WT; (B) Key residues of D30N superimposed on those of the WT. The averaged distances are shown with dashed lines in blue (D30N) and orange (WT). The D30N is shown in pink; (C) The van der Waals interactions between the inhibitor and residues in the WT. The averaged distances are shown with a dashed line; (D) The averaged distances between a bridge water molecule and Ile50/Ile50′/inhibitor, and the distances between the inhibitor and Asp25/Asp25′. Protein is shown in cartoon representation. Chain A is shown in light orange, and chain B in pale green. Key residues are shown in stick representation and labeled with residue names. The inhibitors are shown in stick and ball representation. The key distances are also labeled.

