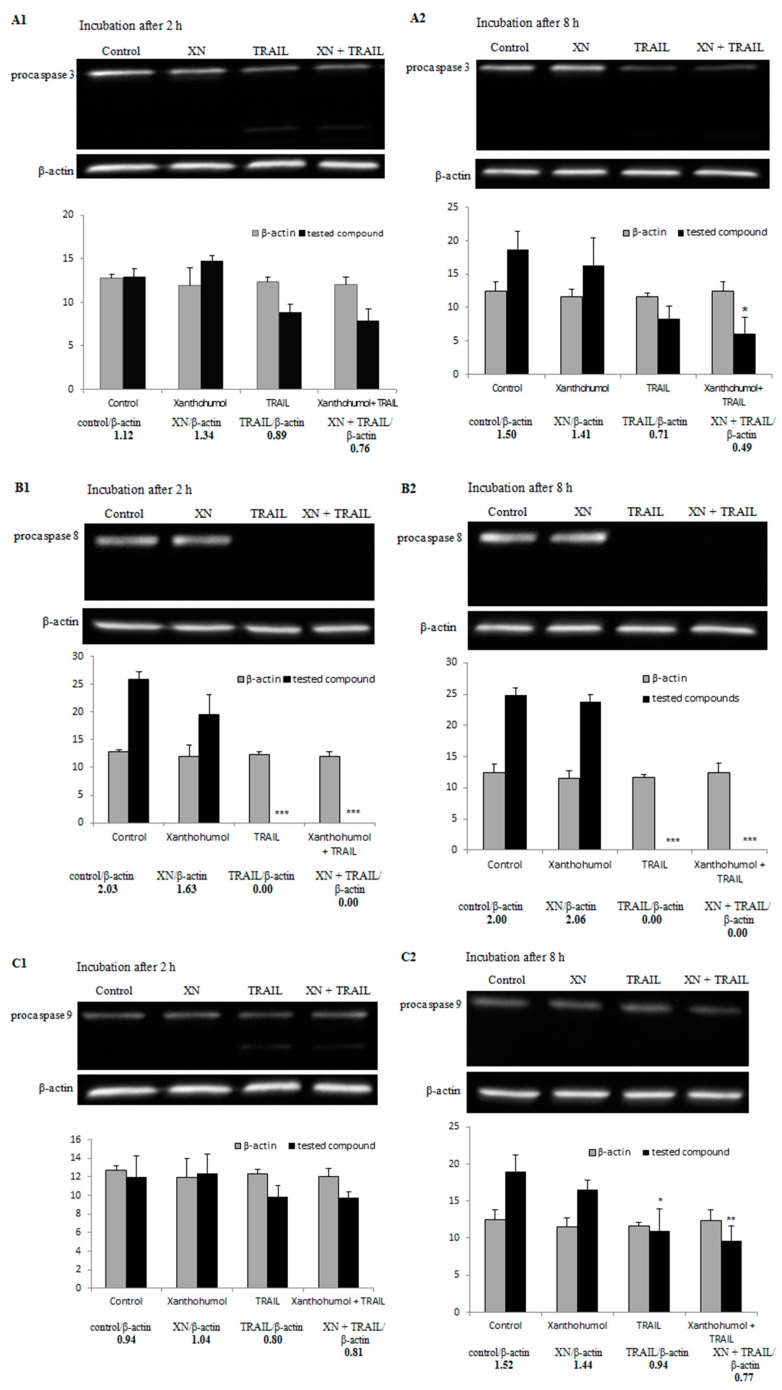
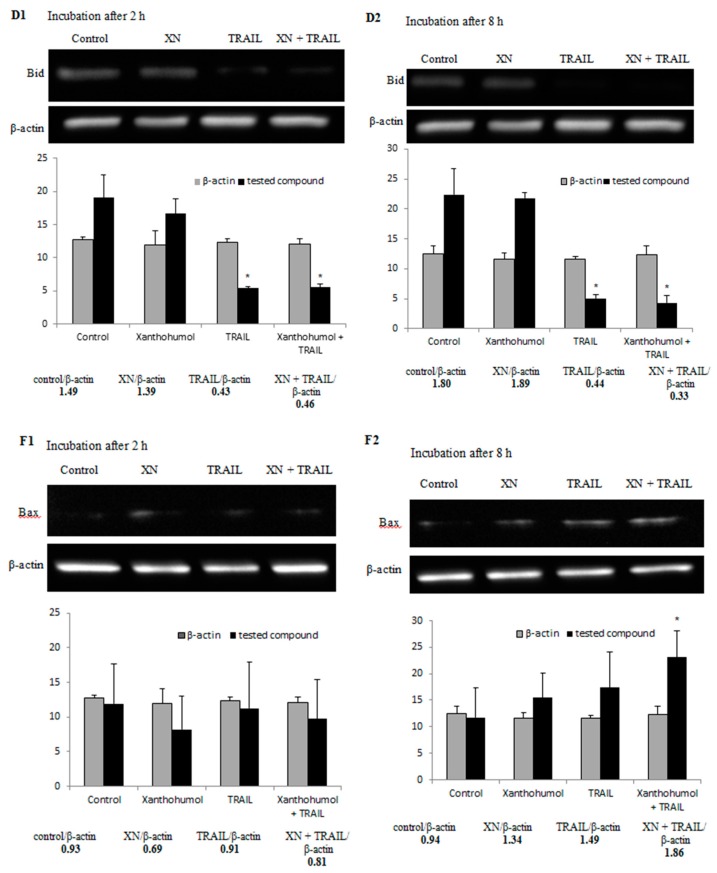
Figure 6.
Effect of TRAIL and/or xanthohumol on the protein expression in LNCaP cells. Cancer cells were treated with 50 µM xanthohumol and/or 100 ng/mL TRAIL for 2 or 8 h. The expressions of (A–C) caspases (-3, -8, -9) and (D–F) Bcl-2 family members (Bid, Bax, Bcl-xL) were measured by the Western blot technique. The results are expressed as means ± SD obtained from three independent experiments. The β-actin was used as a control to show equal loading of proteins. The data were normalized to the control and β-actin level. A statistical significance of the differences between the treatment and control results is marked with * p < 0.05, ** p < 0.01, *** p < 0.001.


