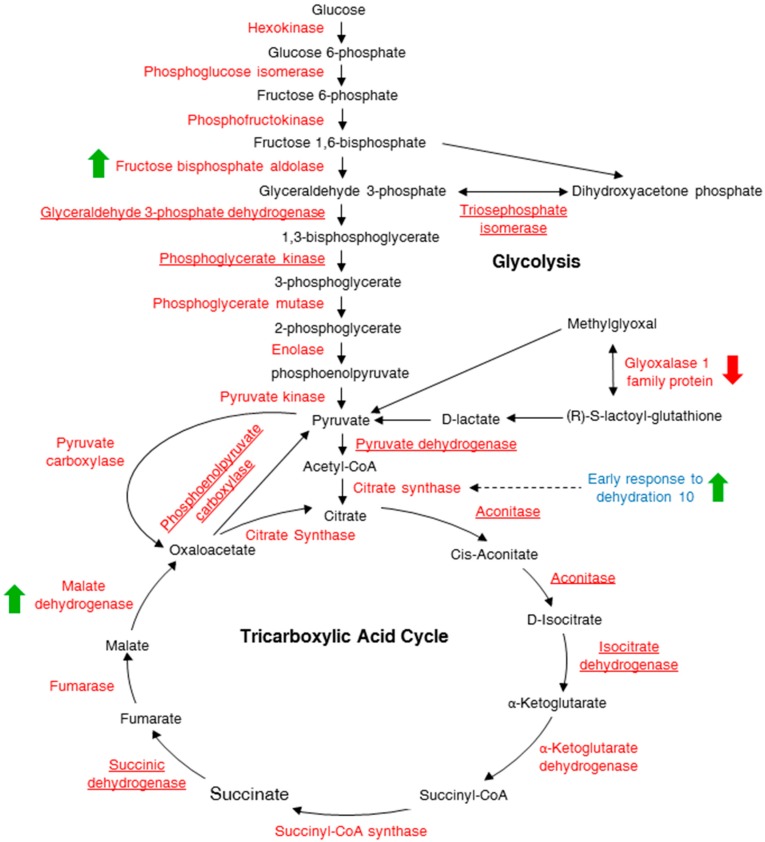
Figure 2.
A schematic diagram of the glycolysis and tricarboxylic acid (TCA) cycle pathways showing proteins differentially expressed post cAMP treatment. The glycolysis and TCA metabolic products are shown in black, the enzymes are in red and a protein associated with the TCA cycle is shown in blue. The green arrows indicate proteins that accumulate in response to cAMP while the red arrow indicates a protein that is reduced in quantity. All the other proteins underlined are some of the proteins identified in the current study that are not changing in abundance after cAMP treatment.

