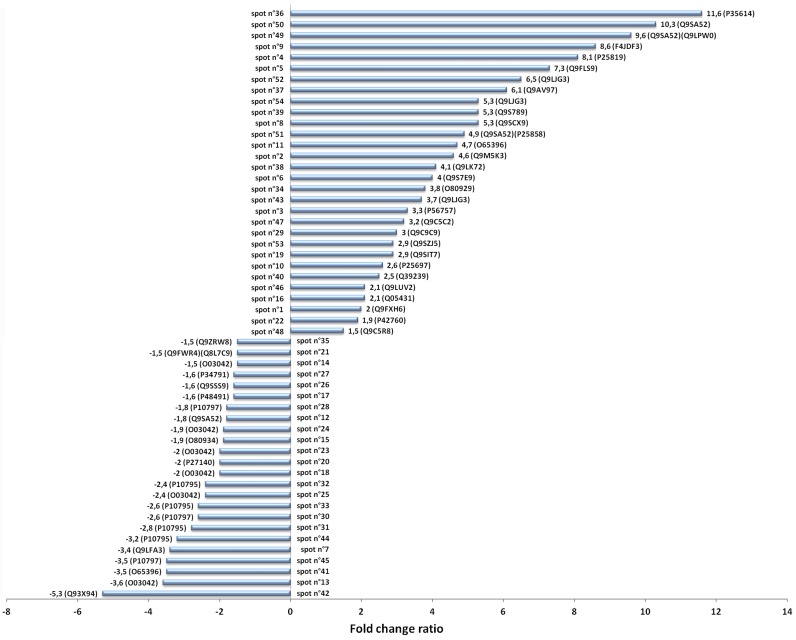
Figure 2.
Level of expression of the identified spots. Data are negative when referred to the down-expressed proteins, while positive when referred to the over-expressed proteins. Numbers near the bar represents the fold ratio and the accession number (Uniprot databank). Bars represent the standard deviation of three replicates. Identification of each spot is provided in Table 1 and Table 2.

