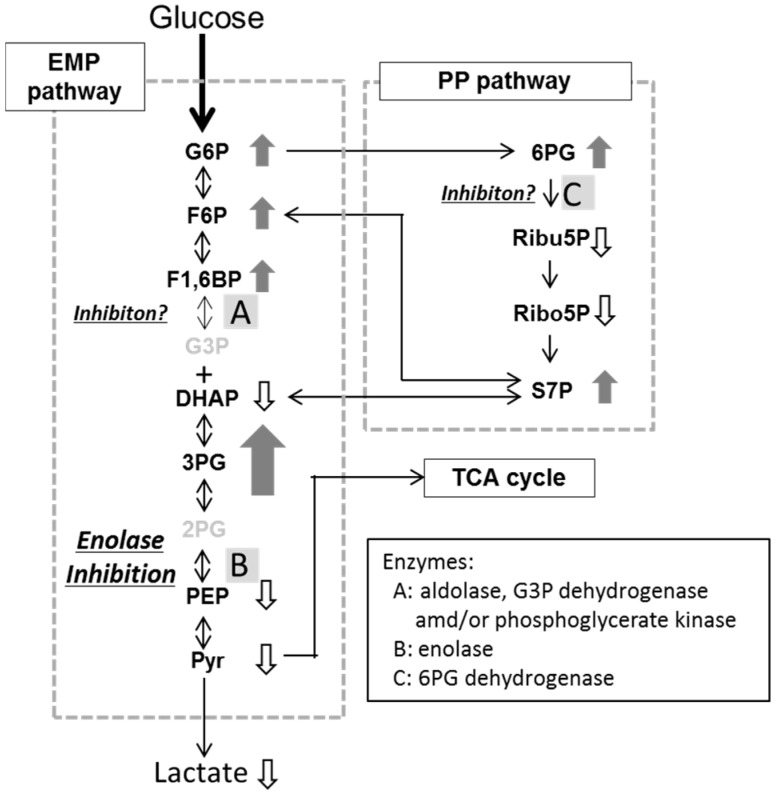
Figure 2.
Schema of the effects of fluoride on the central carbon metabolic pathway. Small arrows with metabolite names, significant increases (upward arrow) or reductions (downward arrow) in the levels of the named metabolites. See Figure 1 for an explanation of the metabolite abbreviations.

