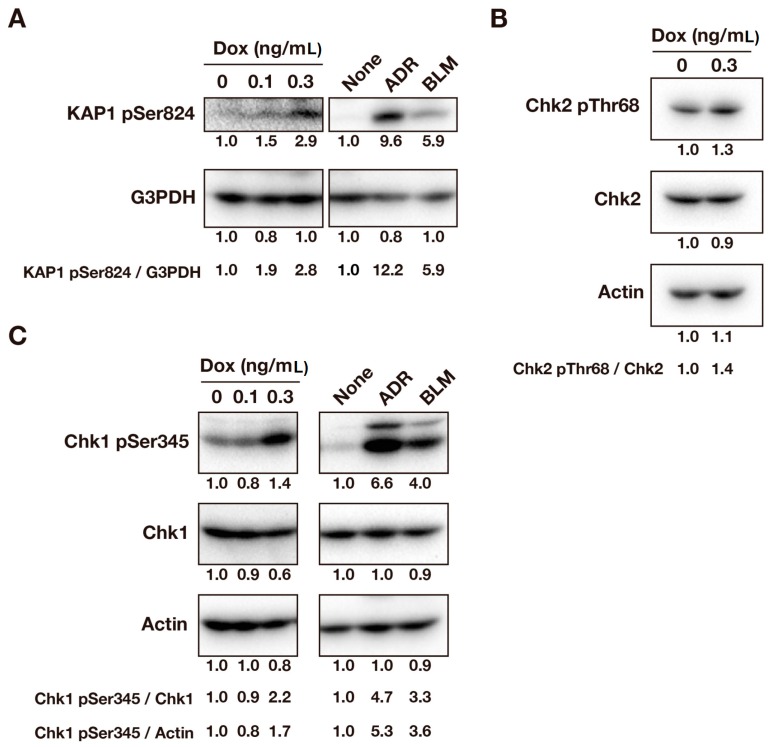
Figure 3.
v-Src induces ATM/ATR activation. HCT116/v-Src cells were cultured with Dox at the indicated concentrations for three days. ADR (300 ng/mL) and BLM (4.46 μg/mL) were used as the positive control and cells were treated for one day before lysate preparation. Whole cell lysates were subjected to a Western blot analysis. A representative result of two independent experiments is shown. (A) Blots were probed with anti-KAP1 pSer824 and anti-G3PDH (loading control) antibodies. KAP1 phosphorylation at Ser824 was quantified by measuring the signal intensities of the bands. The ratios to the levels of G3PDH are shown; (B) Blots were probed with anti-Chk2 pThr68, anti-Chk2, and anti-actin (loading control) antibodies. Chk2 phosphorylation at Thr68 was quantified by measuring the signal intensities of the bands. The ratios to the Chk2 are shown; (C) Blots were probed with anti-Chk1 pSer345, anti-Chk1, and anti-actin (loading control) antibodies. Chk1 phosphorylation at Ser345 was quantified by measuring the signal intensities of the bands. The ratios to the Chk1 and actin levels are shown.

