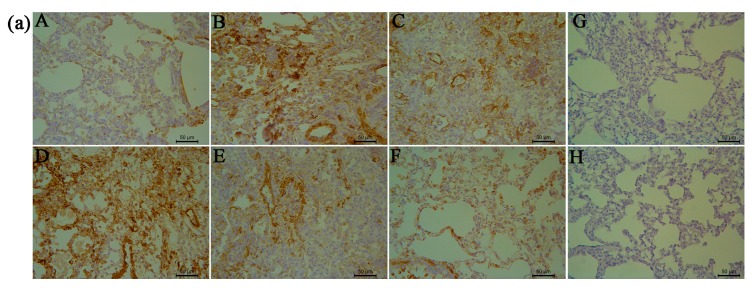
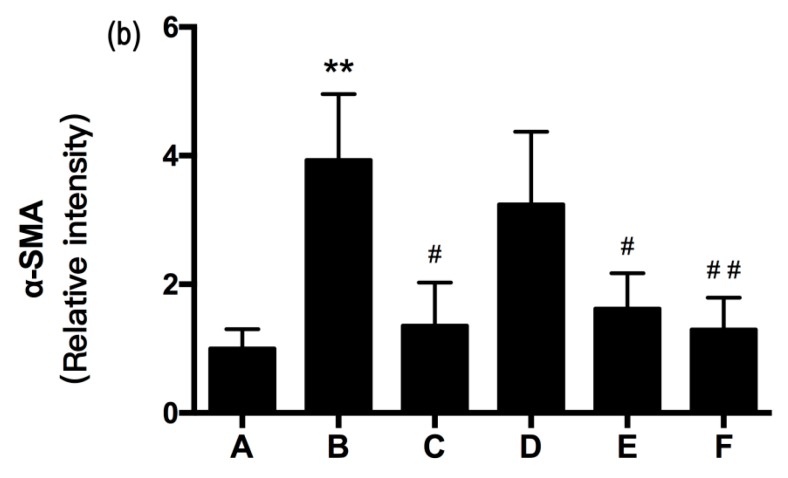
Figure 5.
Effects of RRL on the levels of α-smooth muscle actin (α-SMA) in the lung tissues after bleomycin (BLM)-induced in rats. (a) representative immunohistochemistry image (Bar = 50 μm). (A) normal group; (B) model group; (C) PAG group; (D–F) are RRL groups treated with 125, 250 and 500 mg/kg, respectively; (G) negative control of omitted first antibody; (H) negative control of omitted second antibody; (b) the quantitative analysis of α-SMA protein in lung tissues. Data represent the mean ± standard deviation (SD) (n = 3) (** p < 0.01 vs. normal group, # p < 0.05, ## p < 0.01, vs. model group).


