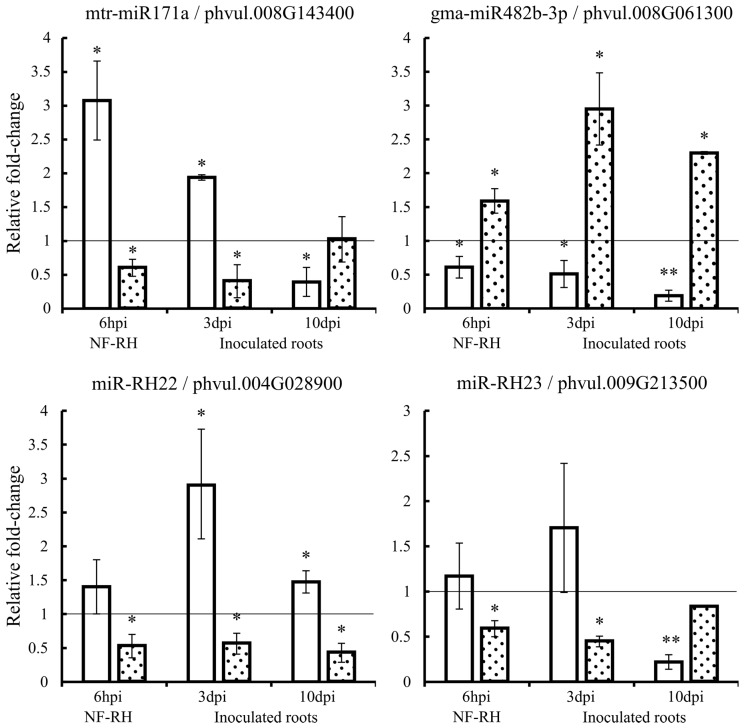
Figure 3.
Relative fold-change expression (qRT-PCR) of mature miRNA (white histograms) and the corresponding targets (dotted histograms) in NF-induced RHs at 6 hpi (hours post induction) (NF-RH) and R. etli-inoculated roots at 3 and 10 dpi (days post inoculation). Values were normalized to the values of the mock control, set at 1 as indicated by the line. Error bars represent the standard error of the mean of the three relative expressions from three biological replicates. Mann-Whitney statistical test, * p < 0.05 & ** p < 0.01.

