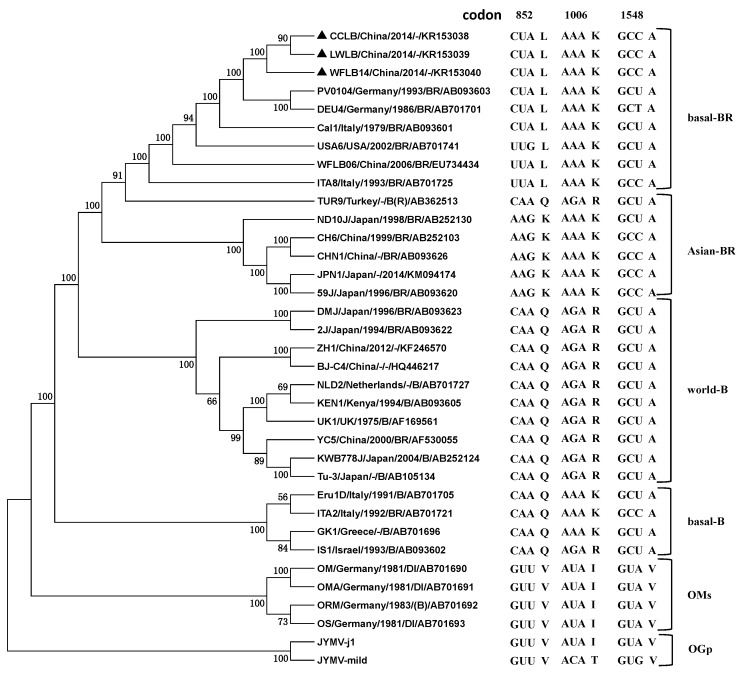
Figure 2.
A maximum likelihood tree showing the relationships inferred from the complete genome sequences of 33 viruses of the TuMV group, together with those of isolates of JYMV as an outgroup (OGp). The branches are horizontal and show, for each genome, the codons at sites 852, 1006 and 1548, numbered as in the alignment used. Bootstrap values (%) more than 60 are listed; nodes with <50% bootstrap support have been collapsed. Isolates are indicated in the tree by isolate name/geographical origin/origin of host/pathotype. “-“ indicates the corresponding information is not available.

