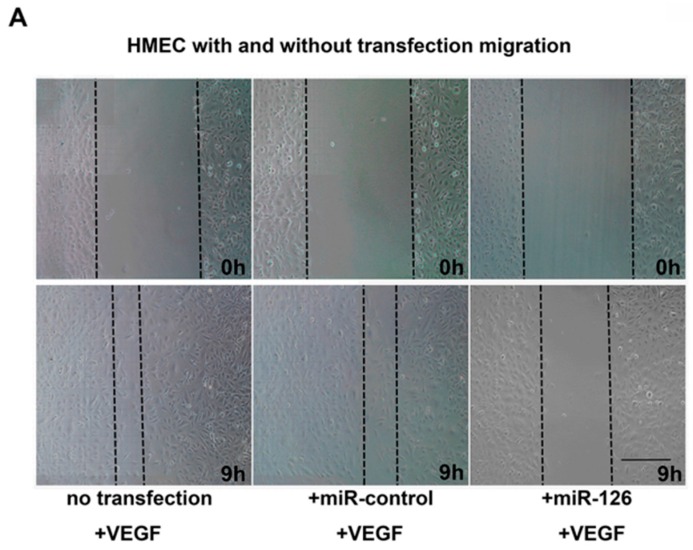
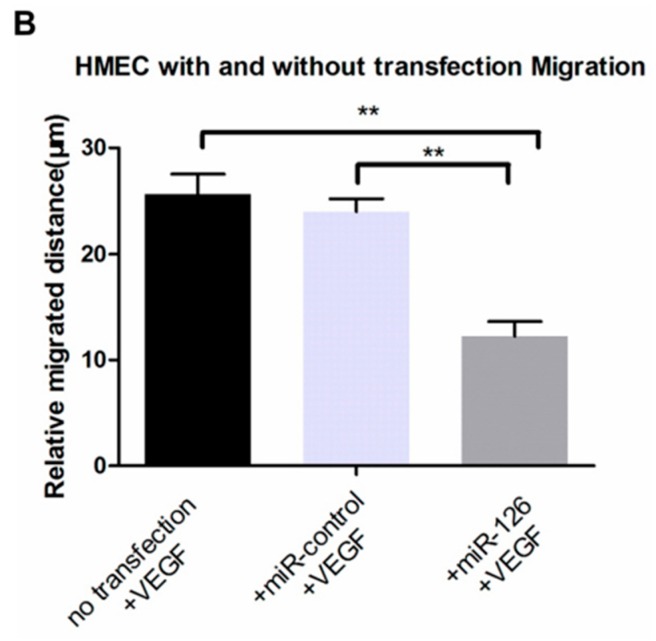
Figure 7.
Inhibition of VEGF-induced cell migration by miR-126 overexpression. (A) Representative images of HMEC migration in different groups at t = 0 h and t = 9 h; Scale bar = 20 μm and (B) analysis of migrated distance of HMECs with no transfection, transfected miR-control or miR-126 mimic group. Data are present as mean migrated distance ± SD (n = 4), ** p < 0.01.


