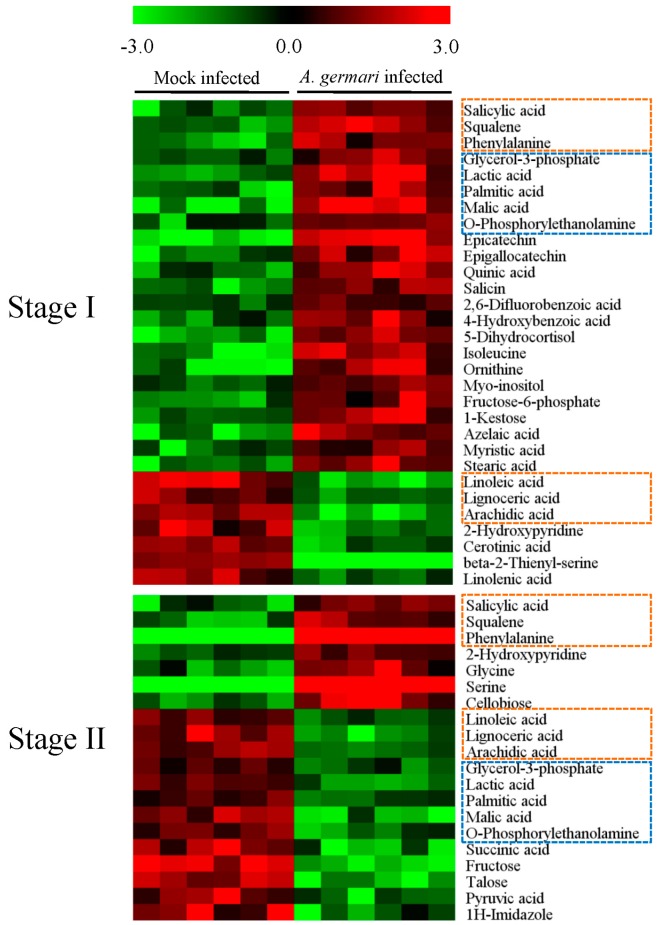
Figure 2.
Differential metabolites associated with A. germari infection in bark tissues. Black bars denoted the sample classes. The columns and rows represented the individual tissue samples and distinct metabolites, respectively. The elevated and decreased levels of a metabolite were showed by increases in the intensities of red and green, respectively. Metabolites which appeared in both stages were marked with boxes. The orange and blue boxes marked metabolites showed similar and opposite changes between stage I and II, respectively.

