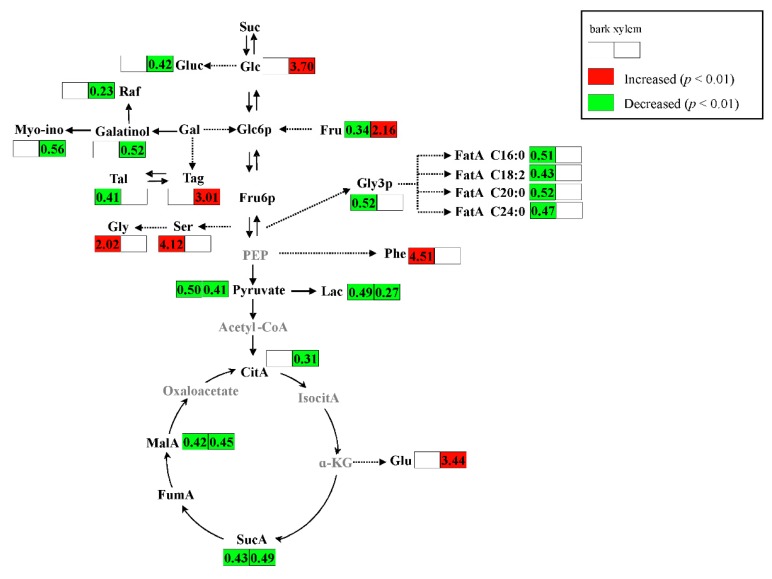
Figure 5.
Level changes of metabolites in the main metabolic pathways. Values in the boxes were ratios of peak intensity of metabolites in A. germari infected samples to those in mock-infected samples. Colors of red and green represented elevated and decreased levels of a metabolite in A. germari infected samples compared with mock-infected samples, respectively. Extended metabolites were marked with gray color. α-KG, alpha-ketoglutarate; CitA, citrate; FatA C16:0, palmitic acid; FatA C18:2, linoleic acid; FatA C20:0, arachidic acid; FatA C24:0, lignoceric acid; Fru, fructose; Fru6P, fructose 6-phosphate; FumA, fumaric acid; Gal, galactose; Glc, glucose; Gluc, Gluconic acid; Glc6P, glucose-6-phosphate; Glu, glutamate; Gly, glycine; Gly3P, glycerol-3-phosphate; IsocitA, isocitric acid; Lac, lactic acid; MalA, malic acid; Myo-ino, Myo-inositol; PEP, phosphoenol-pyruvate; Phe, phenylalanine; Raf, raffinose; Ser, serine; Suc, sucrose; SucA, succinate; Tag, Tagatose; Tal, Talose. Solid and dashed arrows indicated single and multiple enzymatic conversions, respectively.

