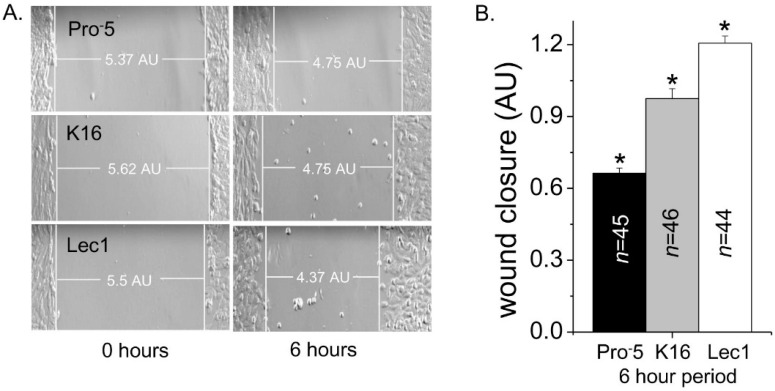
Figure 4.
Rate of CHO cell migration is altered by type of N-glycan. Images were captured at 0 and 6 h time points for parental and N-glycosylated mutant CHO cell lines, as indicated (A); rate of cell wound closure was determined for the various CHO cell lines (B). White lines at the leading edge of the cell monolayers, and the horizontal line connecting these two vertical lines represent the width of the cell wound. n denotes the number of cell wounds measured from four separate experimental days. Asterisks indicate significant differences in mean values at a probability of p < 0.03 using one-way ANOVA with Bonferroni adjustments.

