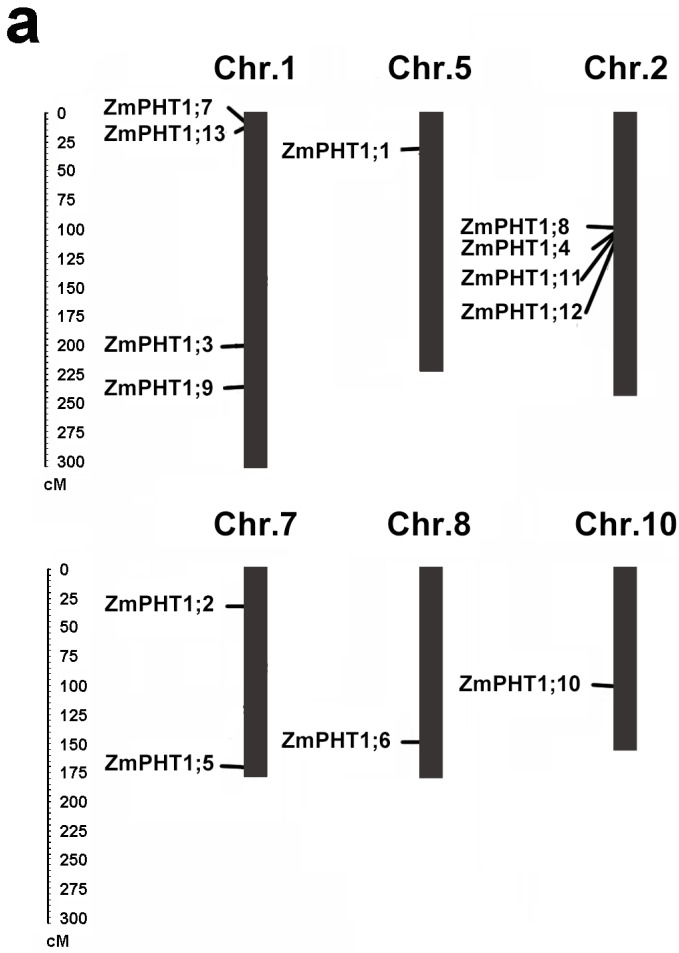
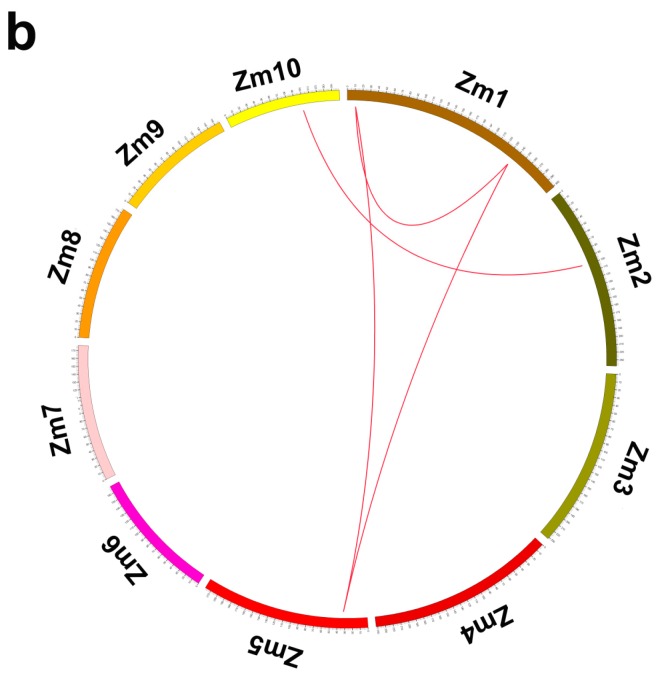
Figure 3.
Distribution and synteny of ZmPHT1 genes. (a) Distribution of ZmPHT1 genes on the maize chromosomes. On the top of each bar is the chromosome number; (b) synteny of ZmPHT1 genes. Zm1–10 represented maize chromosome 1–10, indicated by colored boxes. Chromosome box numbers represent sequence lengths in megabases. All of the syntenic genes were located in the map and linked by red lines.


