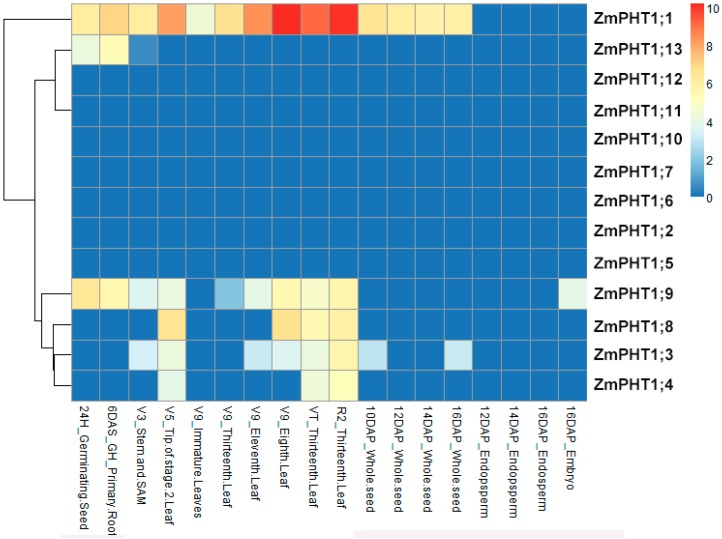
Figure 4.
Heat map of maize ZmPHT1 genes. The expression level of each ZmPHT1 genes can be estimated based on the scale to the right. Red indicates high expression level; yellow indicates medium expression level; and blue indicates low expression level. H, hours; DAS, days after sowing; GH, greenhouse; V, vegetative; DAP, days after pollination; VT, vegetative tasseling; R, reproductive.

